Introduction
Intel® Graphics Performance Analyzers (GPA) offers a wide range of tools to analyze graphics applications across diverse workloads, platforms, and graphics APIs. Within Intel® GPA you can use Graphics Trace Analyzer to explore where you can distribute workloads evenly across CPUs and GPUs. This article will open a trace capture file in Graphics Trace Analyzer while highlighting user interface features to pinpoint CPU and GPU activity based on the captured platform and hardware metrics. Topics covered in this article can be visualized in video format in the Open and Explore Deep Dive video, by checking reference markers in the images associated with this article.
Pre-requisites
Before proceeding with this article, ensure you have the minimum system requirements to successfully analyze graphics applications using Intel® GPA. Also make sure you have downloaded and installed Intel® GPA on your host platform.
Opening a Trace File
While in Graphics Trace Analyzer you can open a trace capture file by either double clicking on the image thumbnail or by pressing the open button once your trace file has been selected. When a trace file is opened for the first time, Graphics Trace Analyzer will display the default layout with the most eligible data shown in the timeline of the tool. Any user specified layout changes to your trace file will be preserved by Graphics Trace Analyzer, allowing you to tailor your layout to fit your specific use case for each individual trace capture. Those layout changes will be saved for each successive time the trace file is opened in Graphics Trace Analyzer.

Exploring the Content (Right) Panel
The right panel of Graphics Trace Analyzer displays all the trace content captured in that specific trace file. This includes performance events captured from a target process, processes contributing to GPU activity within the trace capture period, and essential performance data that was captured from the entire system within that period. Elements in this panel can be visualized in the timeline of Graphics Trace Analyzer. Events showing thread activity can be viewed in the CPU context queue of the timeline, events showing GPU utilization can be viewed in the GPU tracks of the timeline and other events can be viewed in the process thread tracks of the timeline. You can toggle on and off visualization of these elements by clicking on their names. In the dark color scheme, blue text indicates timeline visualization is enabled for that element, and grey text indicates that timeline visualization is disabled for that element.
NOTE: Toggling off parent elements will disable timeline visualization for all child elements that succeed it.
Exploring the Track Information (Left) Panel
The left panel of Graphics Trace Analyzer displays a track description consisting of the name of the content for that track and the name of the process or platform that the track belongs to. Both the left and right panels can be resized by clicking on the control boundary and then by dragging the panel until it is resized to your preferences.
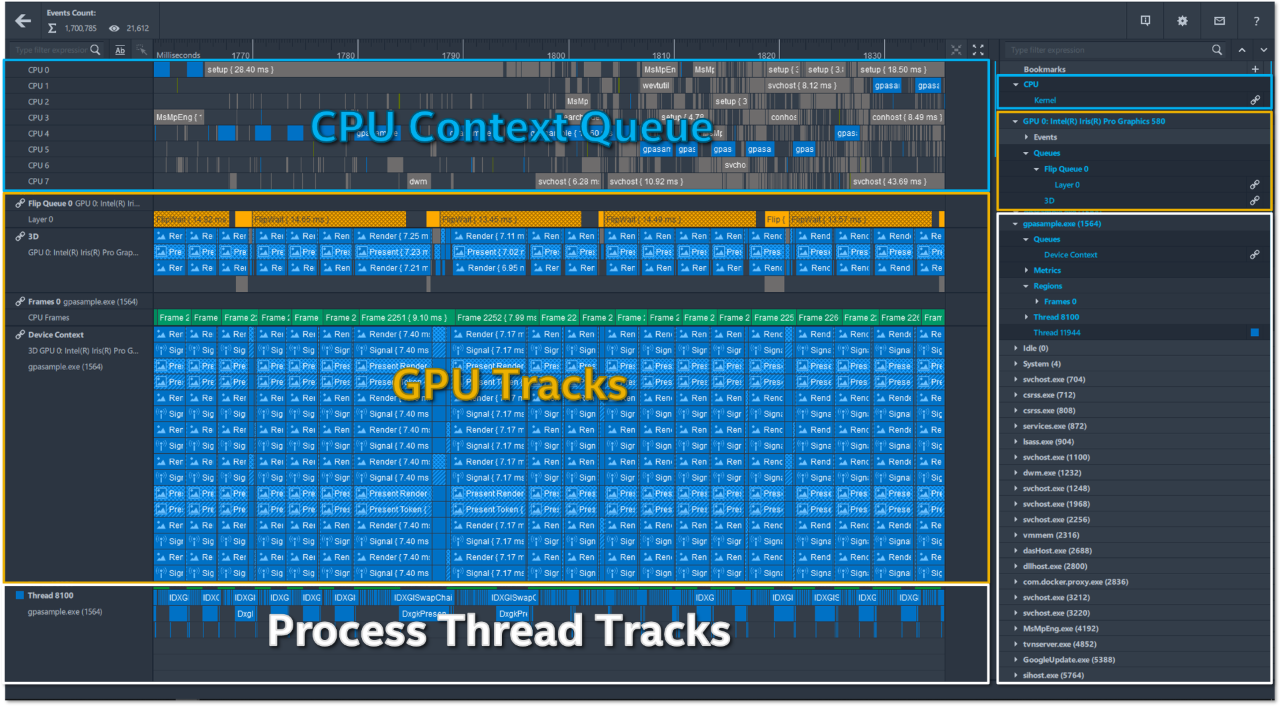
Exploring the Timeline (Center) Panel
Graphics Trace Analyzer visually represents a variety of different track types including the following:
Aggregated CPU Activity
Reflects thread execution on CPU cores used to analyze thread execution order, execution duration and distribution between CPU cores.

Hardware GPU Queue
Consists of all video adapters generating graphics content and visualizes GPU utilization over time including the execution of Direct Memory Access packages on the GPU.

Flip Queues
Contains all active video adapters and reflect the relationship between the application’s present calls, present packages of GPU and CPU queues, and Vertical Synchronization events of the monitor, otherwise known as VSync events.

CPU Frames
Displays the range containing graphics commands between two successive frame buffer swap calls.

Device Context Queue
Demonstrates rendering command packages formed by a user-mode graphics driver for each graphics rendering created in the scope of a process. The content of each device context queue depends on the hardware, graphics driver and graphics API used for rendering.

Thread Scope Debug and ITT Regions and Markers
Displays the result of user-defined instrumentation of profiled applications, matched with performance data generated by the system. Application threads containing captured performance events have a thread activity zone above the track containing that threads active and idle states.

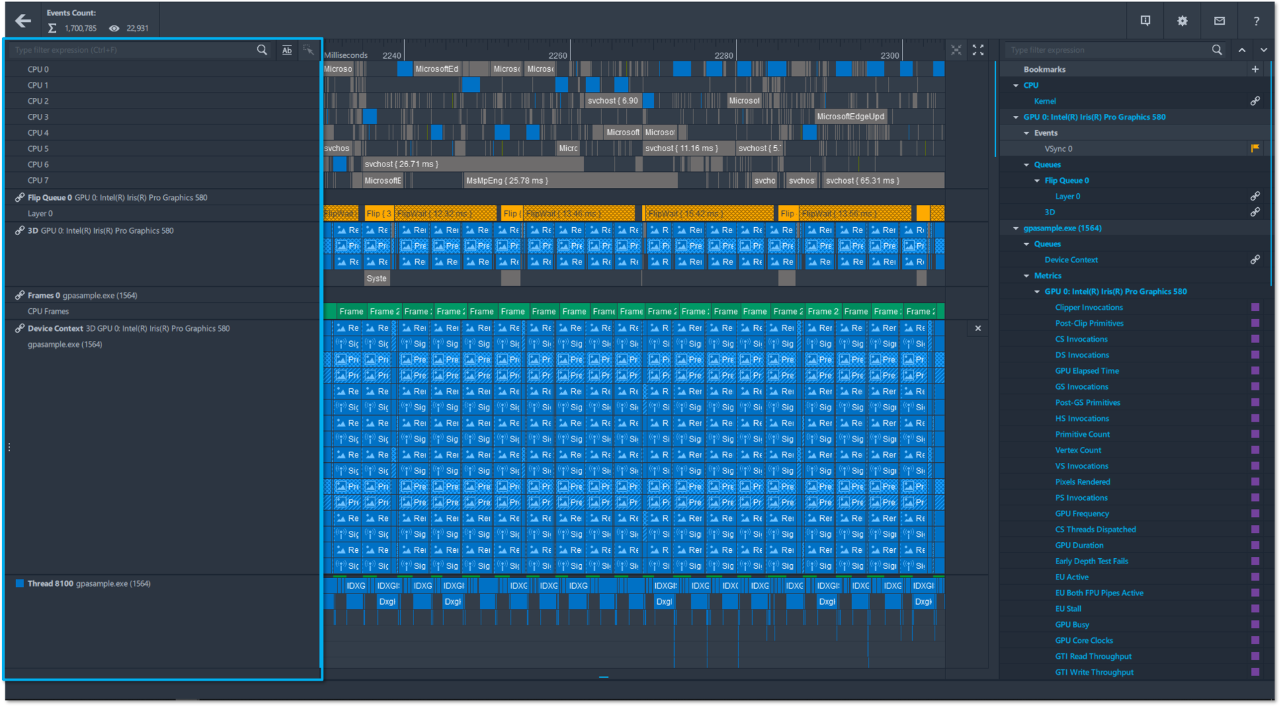
Metrics
There are several CPU and GPU metric processes that can be visualized in the timeline of Graphics Trace Analyzer. To visualize metrics, you must have enabled them in Graphics Monitor or System Analyzer before capturing a trace. The timeline can visualize an unlimited number of CPU and GPU metrics. Event markers are organized according to the provider, for example ETW Providers on Windows. Hovering over the metric bar graphs in the timeline will display various metric data throughout the course of the trace capture.

Conclusion
The article demonstrated how to open a trace capture file in Graphics Trace Analyzer, and then we explored user interface features in the tool to customize the layout of your explicit trace file to fit your use case. For more information on how to identify and analyze problem areas in your applications to distribute workloads evenly across CPUs and GPUs, continue reading the Graphics Trace Analyzer Deep Dive articles.
Additional Resources
Part 1: Configure and Capture Trace (Article)
Part 2: Open and Explore Trace (Video)