Profiling an OpenMP* Offload Application running on a GPU
Use this recipe to build and compile an OpenMP* application offloaded onto an Intel GPU. The recipe also describes how to use Intel® VTune™ Profiler to run analyses with GPU capabilities (HPC Performance Characterization, GPU Offload, and GPU Compute/Media Hotspots) on the OpenMP application and examine results.
Content expert: Cory Levels
Ingredients
Here are the minimum hardware and software requirements for this performance analysis.
Application: iso3dfd_omp_offload OpenMP Offload sample. This sample application is available as part of the code sample package for Intel® oneAPI toolkits.
Compiler: To profile a SYCL* application, you need the Intel® oneAPI DPC++/C++ Compiler that is available with the Intel® oneAPI Base Toolkit.
Tools: Intel® VTune™ Profiler
- HPC Performance Characterization analysis
- GPU Offload analysis
- GPU Compute/Media Hotspots analysis
NOTE:Starting with the 2020 release, Intel® VTune™ Amplifier has been renamed to Intel® VTune™ Profiler.
Most recipes in the Intel® VTune™ Profiler Performance Analysis Cookbook are flexible. You can apply them to different versions of Intel® VTune™ Profiler. In some cases, minor adjustments may be required.
Get the latest version of Intel® VTune™ Profiler:
From the Intel® VTune™ Profiler product page.
Download the latest standalone package from the Intel® oneAPI standalone components page.
Microarchitecture:
Intel Processor Graphics Gen 9 or newer
Operating system:
Linux* OS, kernel version 4.14 or newer
Windows* 10 OS
System Configuration:
Linux* OS: Follow instructions in Configure Your CPU or GPU System (Linux)
Windows*: Follow instructions in Configure Your CPU or GPU System (Windows)
Build and Compile the OpenMP Offload Application
On Linux OS:
Set oneAPI environment variables. Run setvars.h. You can find this script here: . /opt/intel/oneapi/setvars.sh
Go to the sample directory.
cd <sample_dir>/DirectProgramming/C++/StructuredGrids/iso3dfd_omp_offload
Compile the OpenMP Offload application:
mkdir build;
cd build;
cmake -DVERIFY_RESULTS=0 -DCMAKE_CXX_FLAGS="-g -mllvm -parallel-source-info=2"  ..
make -j
This generates an src/iso3dfd executable.
To delete the program, type:
make clean
This removes the executable and object files that were created by the make command.
On Windows OS:
Set oneAPI environment variables. Run setvars.bat. You can find this script here: C:\Program Files (x86)\Intel\ oneAPI \setvars.bat.
Open the sample directory:
cd <sample_dir>/ DirectProgramming/C++/StructuredGrids/iso3dfd_omp_offload
Compile the OpenMP Offload application:
mkdir build
cd build
icx /Zi -mllvm -parallel-source-info=2 /std:c++17 /EHsc /Qiopenmp /I../include\ /Qopenmp-targets:spir64 /DUSE_BASELINE /DEBUG ..\src\iso3dfd.cpp ..\src\iso3dfd_verify.cpp ..\src\utils.cpp
Run HPC Performance Characterization Analysis on the OpenMP Offload Application
To get a high-level summary of the performance of the OpenMP Offload application, run the HPC Performance Characterization analysis. This analysis type can help you understand how your application utilizes the CPU, GPU, and available memory. You can also see the extent to which your code is vectorized.
For OpenMP offload applications, the HPC Performance Characterization analysis shows you the hardware metrics associated with each of your OpenMP offload regions.
Prerequisites: Prepare the system to run a GPU analysis. See Set Up System for GPU Analysis.
Open VTune Profiler and click on New Project to create a project.
On the welcome page, click on Configure Analysis to set up your analysis.
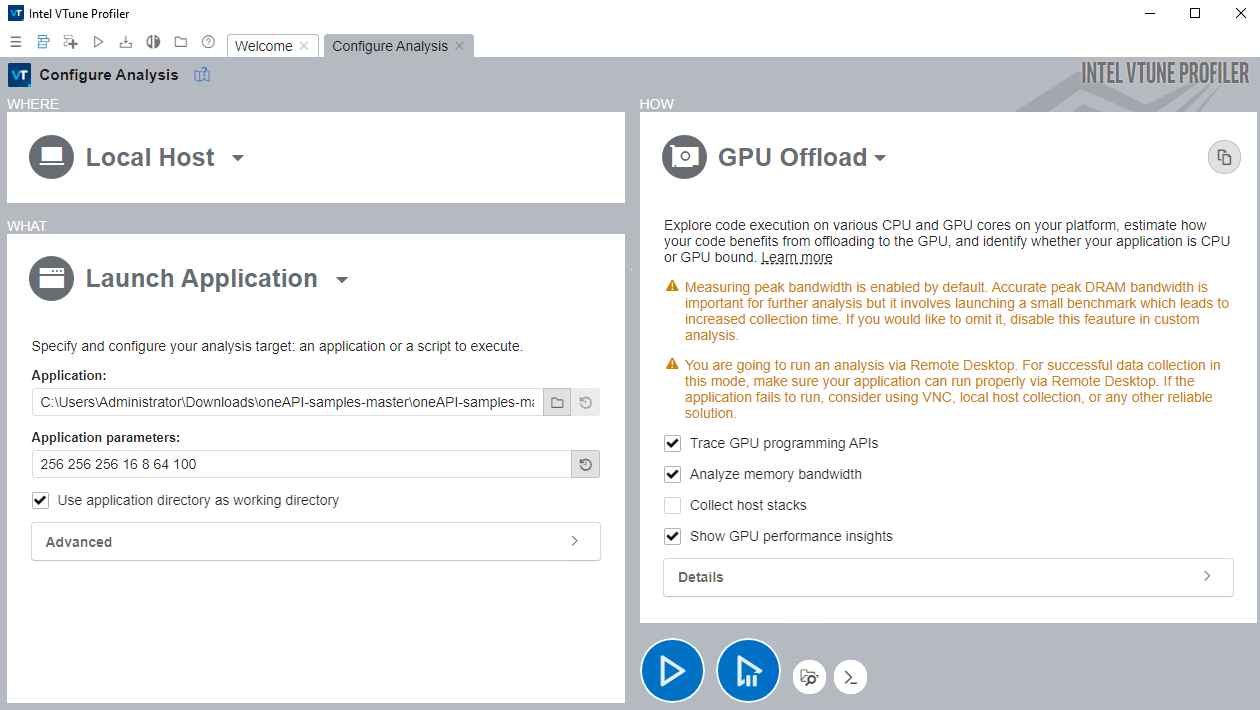
- Select these settings for your analysis.
- In the WHERE pane, select Local Host.
- In the WHAT pane, select Launch Application and specify the iso3dfd_omp_offload binary as the application to profile.
- In the HOW pane, select the HPC Performance Characterization analysis type from the Parallelism group in the Analysis Tree.
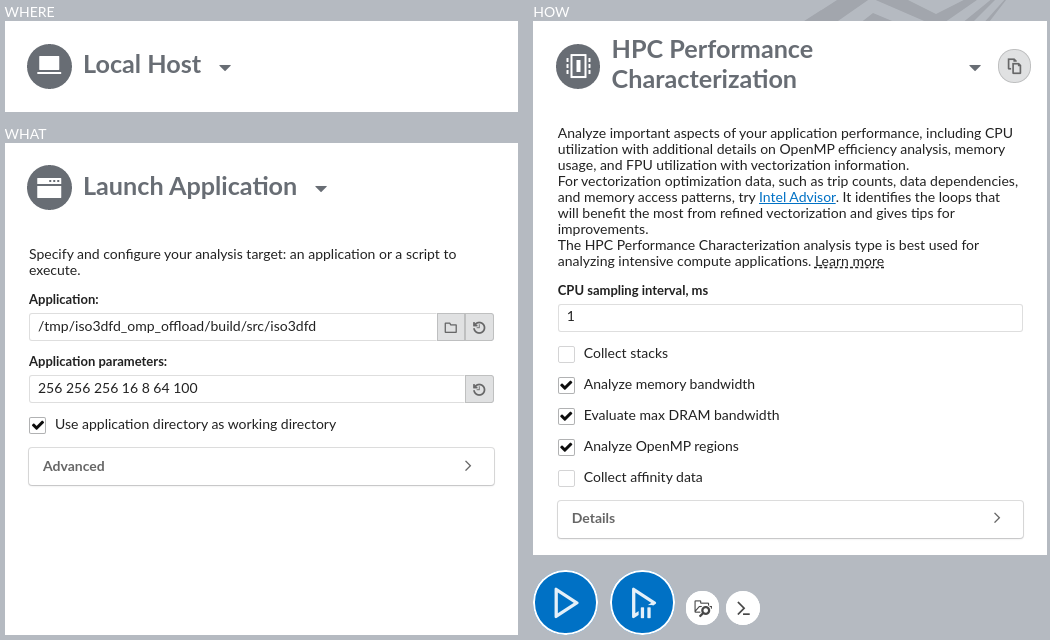
Click the Start button to run the analysis.
Run Analysis from Command Line:
To run the HPC Performance Characterization analysis form the command line:
On Linux OS:
Set VTune Profiler environment variables by exporting the script:
export <install_dir>/vtune-vars.sh
Run the HPC Performance Characterization analysis:
vtune -collect hpc-performance -- src/iso3dfd 256 256 256 16 8 64 100
On Windows OS:
Set VTune Profiler environment variables by running the batch file:
<install_dir>\vtune-vars.bat
Run the HPC Performance Characterization analysis:
vtune -collect hpc-performance -- iso3dfd.exe 256 256 256 16 8 64 100
Analyze HPC Performance Characterization Data
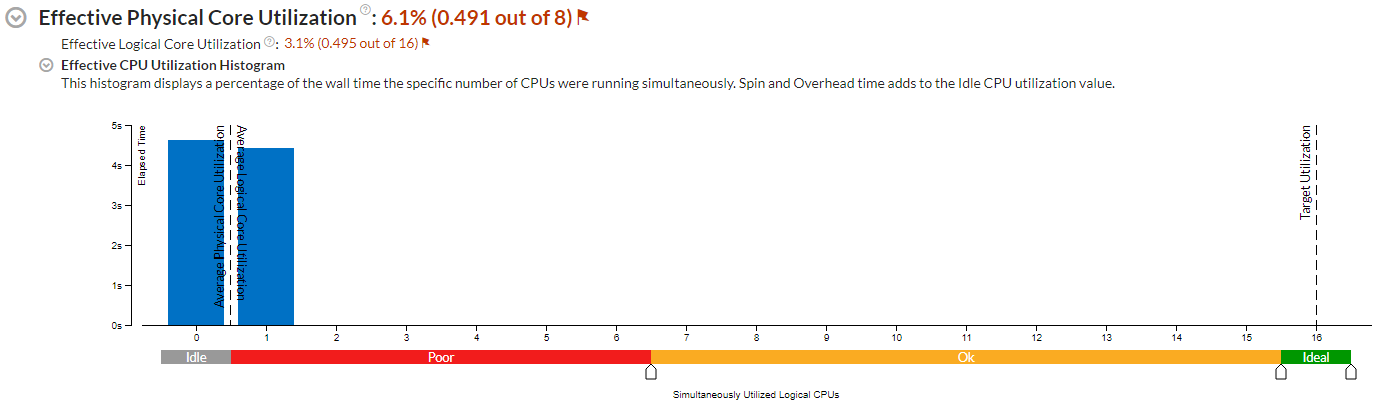
Start your analysis by examining the Summary pane. Look at the Effective Physical Core Utilization (or Effective Logical Core Utilization) and GPU Stack Utilization sections to see highlighted issues, if any.
In the GPU Stack Utilization section, look at the top OpenMP offload regions sorted by offload time spent in those regions. You can see GPU utilization in each of these offload regions.
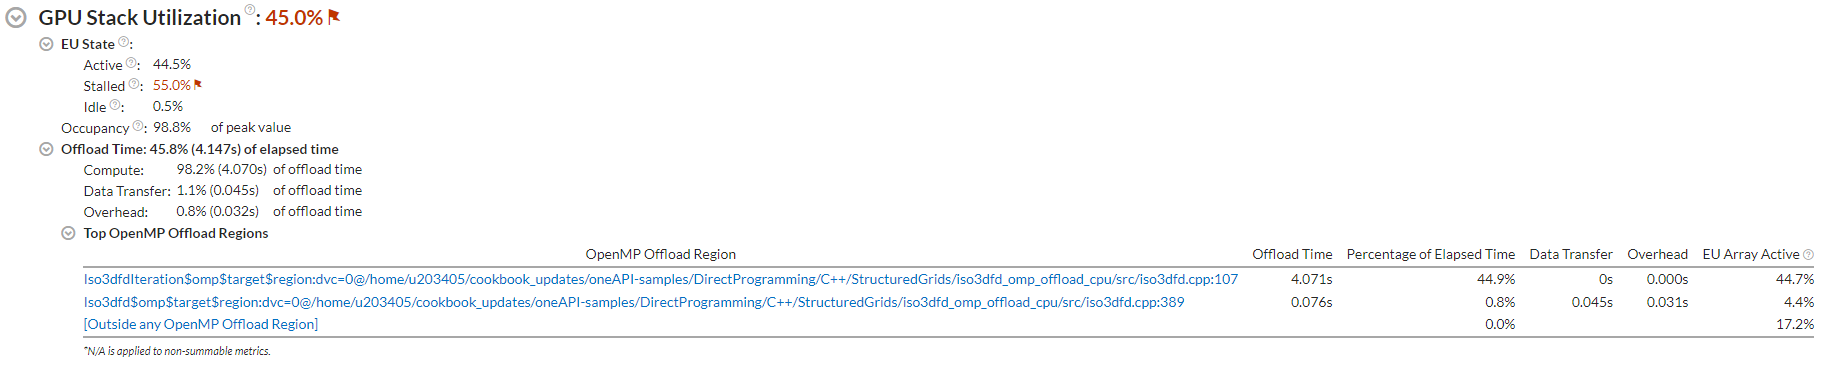
If you compiled your application with the full set of debug information, the names of the regions will contain their source locations. This includes:
- Name of the function
- Name of the source file
- Line number
Generate a Summary Report From the Command Line
To generate a summary report from the command line, type:
vtune -report summary -r <result>
In this example, the offload activity is classified almost entirely as Compute activity. Also, a single offload region consumed the majority of offload time. Click on its name to switch to the Bottom-Up view. Examine the grouping table with OpenMP offload region durations, region instance counts, and metrics for GPU and CPU.
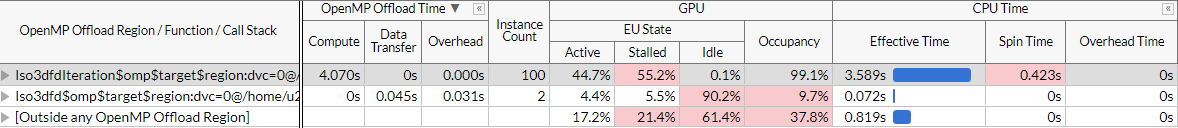
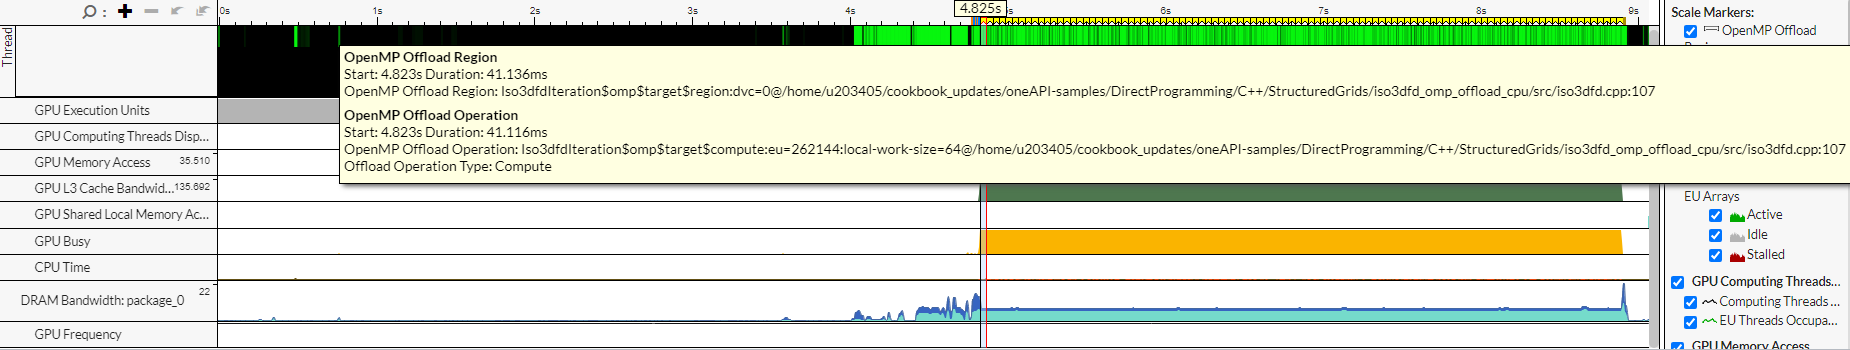
Hover over the region markers at the top of the timeline view. You can see the name and duration of each offload region and offload operation within that region. The GPU metrics in the timeline help you understand how every instance of an offload region behaves over time.
Generate a Hotspots Report Grouped by Offload Region From the Command Line
To generate a Hotspots report (grouped by offload region) from the command line, type:
vtune -report hotspots -group-by=offload-region -r <result>
These details establish that GPU activity played an important role in the performance of this application. Next, let us run the GPU Offload Analysis to learn more.
Run GPU Offload Analysis on the OpenMP Offload Application
Prerequisites: If you have not already done so, prepare the system to run a GPU analysis. See Set Up System for GPU Analysis.
On the Analysis Tree, in the Accelerators group, select the GPU Offload analysis type .
Select these settings for your analysis:
Click the Start button to run the analysis.
Run Analysis from Command Line:
To run the GPU Offload analysis form the command line:
On Linux OS, type:
vtune -collect gpu-offload – src/iso3dfd 256 256 256 16 8 64 100
On Windows OS, type:
vtune -collect gpu-offload - iso3dfd.exe 256 256 256 16 8 64 100
Analyze GPU Offload Analysis Data
Start your analysis with the GPU Offload viewpoint.
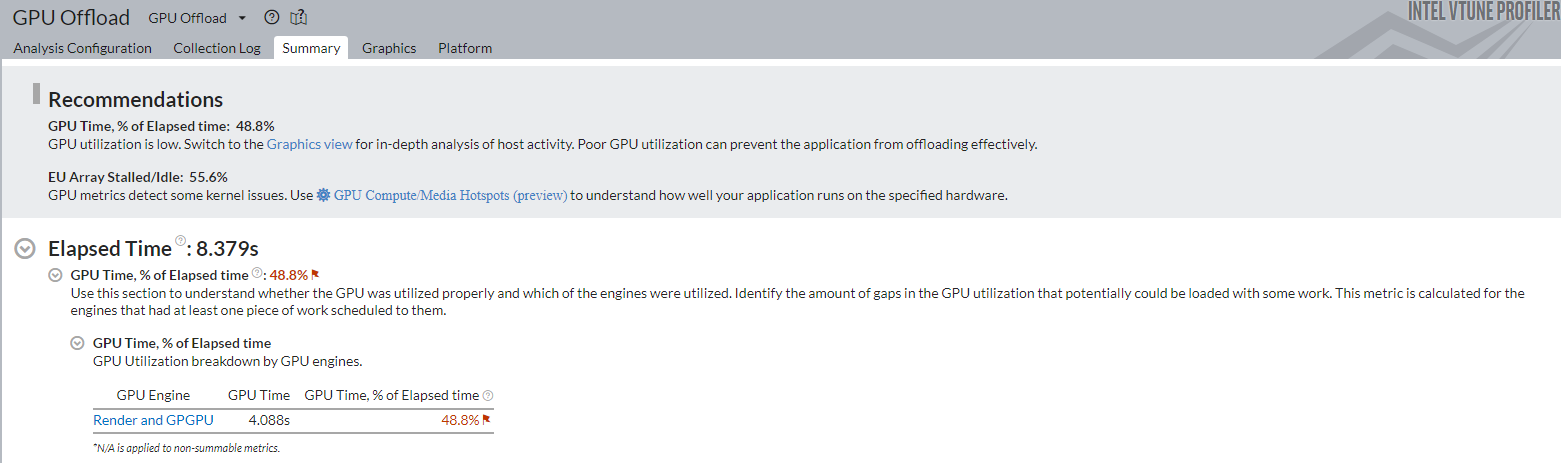
In the Summary window, see statistics on CPU and GPU resource usage. Use this data to determine if your application is:
- GPU-bound
- CPU-bound
- Utilizing the compute resources of your system inefficiently
NOTE:
Families of Intel® Xe graphics products starting with Intel® Arc™ Alchemist (formerly DG2) and newer generations feature GPU architecture terminology that shifts from legacy terms. For more information on the terminology changes and to understand their mapping with legacy content, see GPU Architecture Terminology for Intel® Xe Graphics.
Switch to the Platform window. Here, you can see basic CPU and GPU metrics that help analyze GPU usage on a software queue. This data is correlated with CPU usage on the timeline.
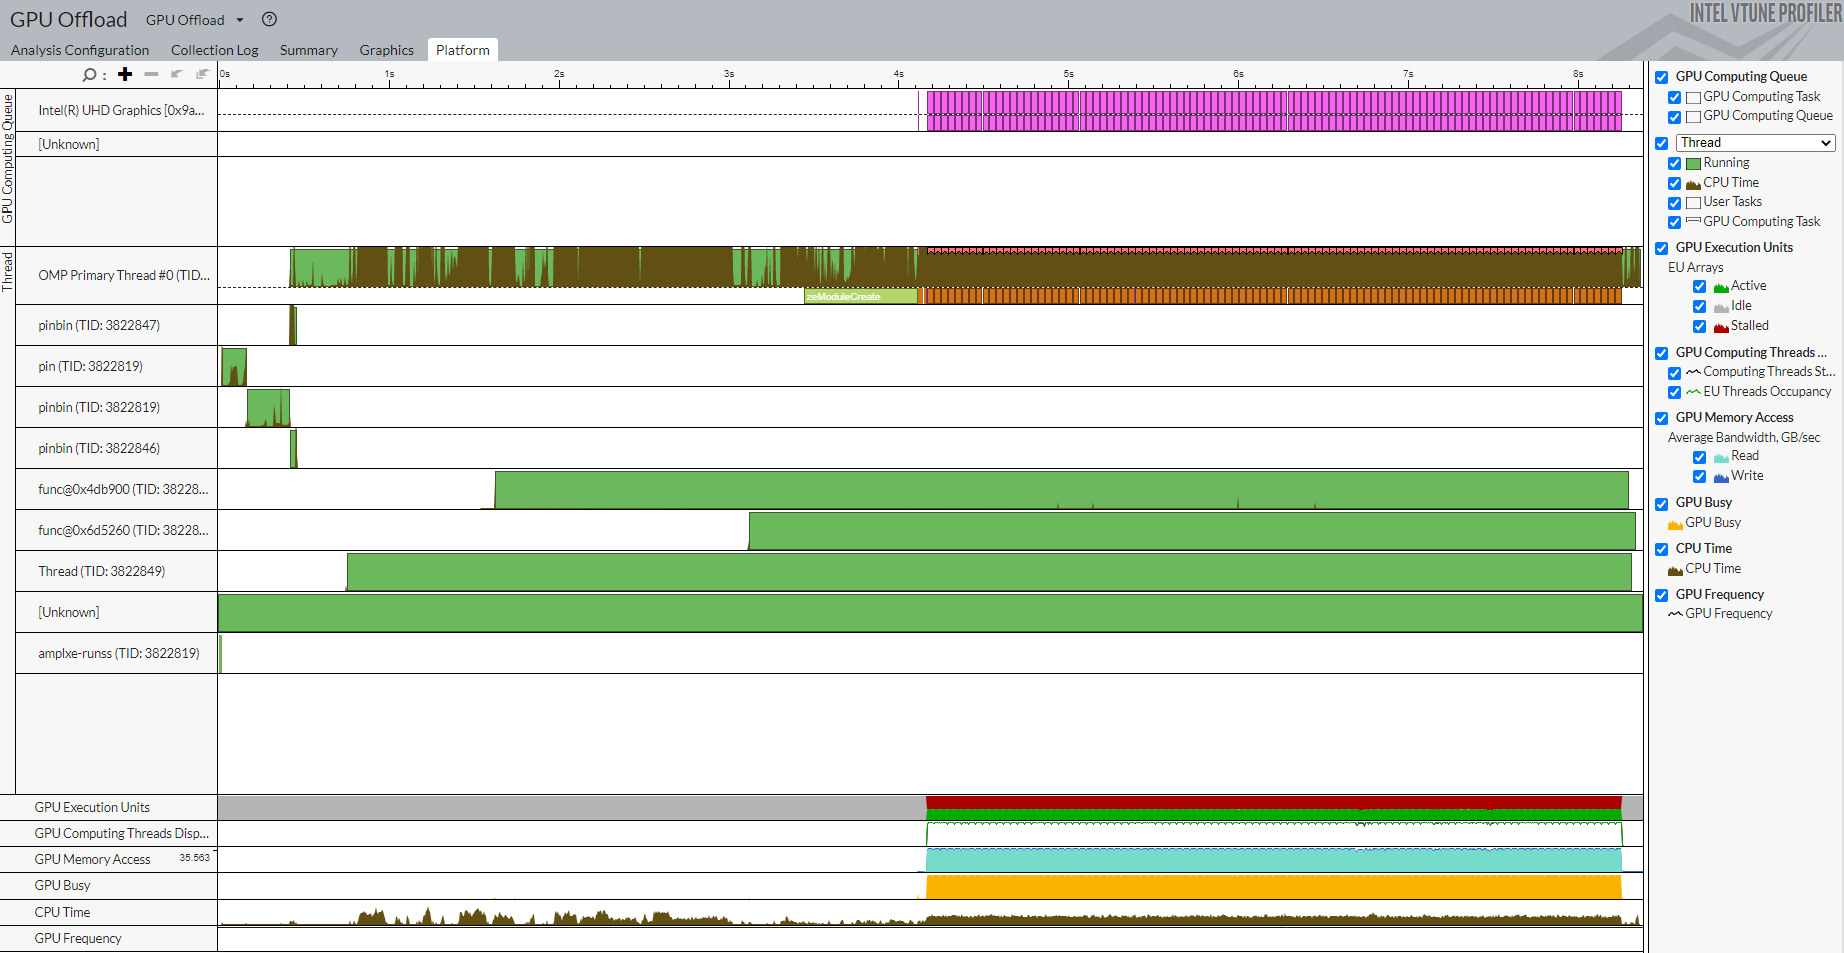
The information in the Platform window can help you make some inferences.
GPU Bound Applications |
CPU Bound Applications |
|---|---|
The GPU is busy for a majority of the profiling time. |
The CPU is busy for a majority of the profiling time. |
There are small idle gaps between busy intervals. |
There are large idle gaps between busy intervals. |
The GPU software queue is rarely reduced to zero. |
NOTE:
Most applications may not present obvious situations as described here. A detailed analysis is important to understand all dependencies. For example, GPU engines that are responsible for video processing and rendering are loaded in turns. In this case, they are used in a serial manner. When the application code runs on the CPU, this can cause an ineffective scheduling on the GPU. The behavior can mislead you to interpret the application to be GPU bound.
Identify the GPU execution phase based on the computing task reference and GPU Utilization metrics. Then, you can define the overhead for creating the task and placing it into a queue.
To investigate a computing task, switch to the Graphics window to examine the type of work (rendering or computation) running on the GPU per thread. Select the Computing Task grouping and use the table to study the performance characterization of your task.

Generate a Hotspots Report Grouped by Computing Task From the Command Line
To generate a Hotspots report (grouped by computing task) from the command line, type:
vtune -report hotspots -group-by=computing-task -r <result>
Use the README file in the sample to profile other implementations of iso3dfd_omp_offload code.
In the next section, continue your investigation with the GPU Compute/Media Hotspots analysis.
Run GPU Compute/Media Hotspots Analysis on the OpenMP Offload Application
Prerequisites: If you have not already done so, prepare the system to run a GPU analysis. See Set Up System for GPU Analysis.
To run the analysis:
In the Accelerators group, select the GPU Compute/Media Hotspots analysis type.
Configure analysis options as described in the previous section.
Click the Start button to run the analysis.
Run Analysis from Command Line
To run the analysis from the command line:
On Linux OS:
vtune -collect gpu-hotspots - src/iso3dfd 256 256 256 16 8 64 100
On Windows OS:
vtune -collect gpu-hotspots - iso3dfd.exe 256 256 256 16 8 64 100
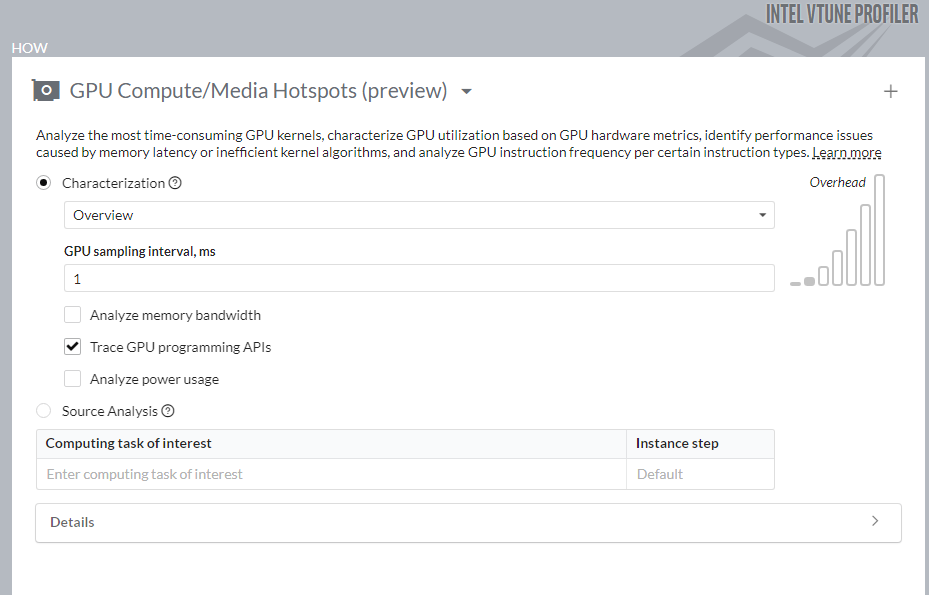
Analyze Your Compute Task
The default analysis configuration invokes the Characterization profile with the Overview metric set. In addition to individual compute task characterization that is available through the GPU Offload analysis, VTune Profiler provides memory bandwidth metrics that are categorized by different levels of GPU memory hierarchy.

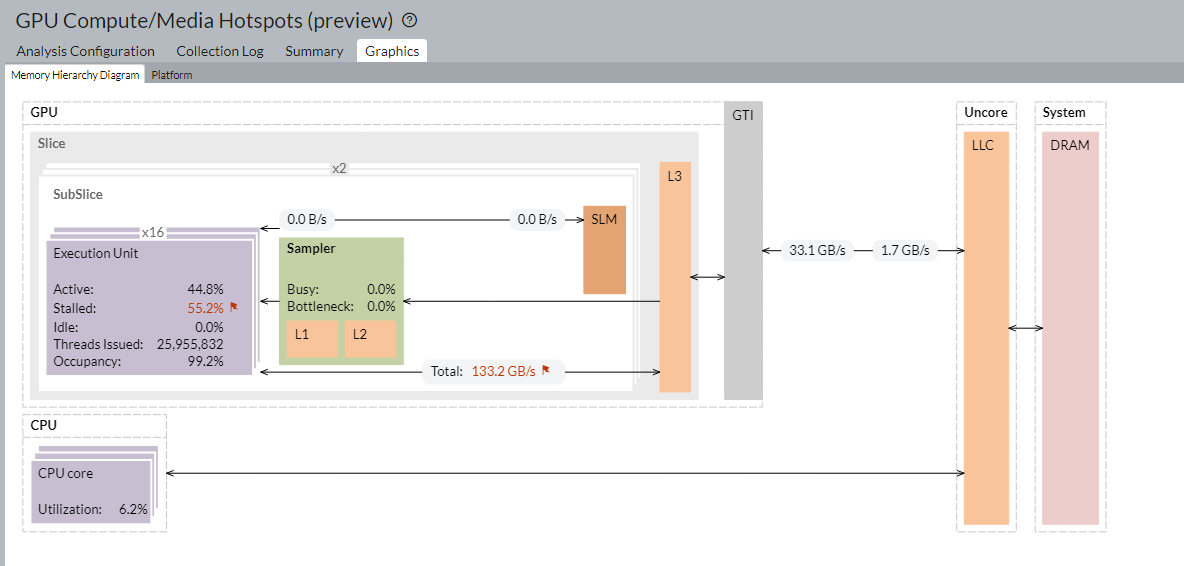
For a visual representation of the memory hierarchy, see the Memory Hierarchy Diagram. This diagram reflects the microarchitecture of the current GPU and shows memory bandwidth metrics. Use the diagram to understand the data traffic between memory units and execution units. You can also identify potential bottlenecks that cause EU stalls.
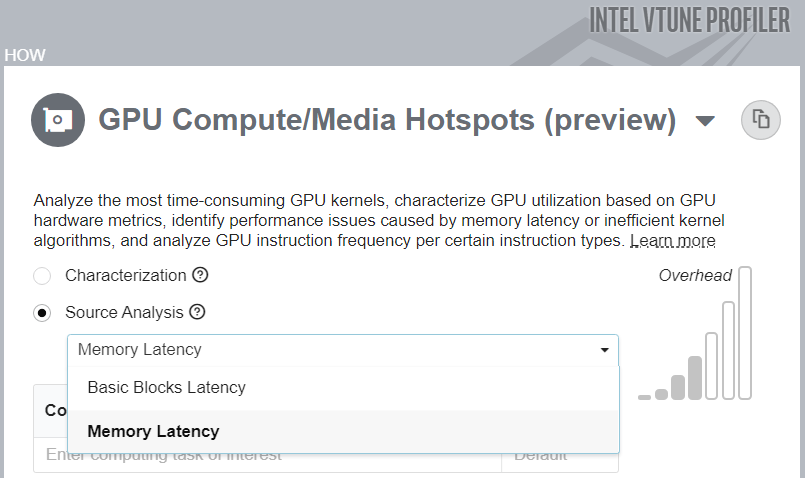
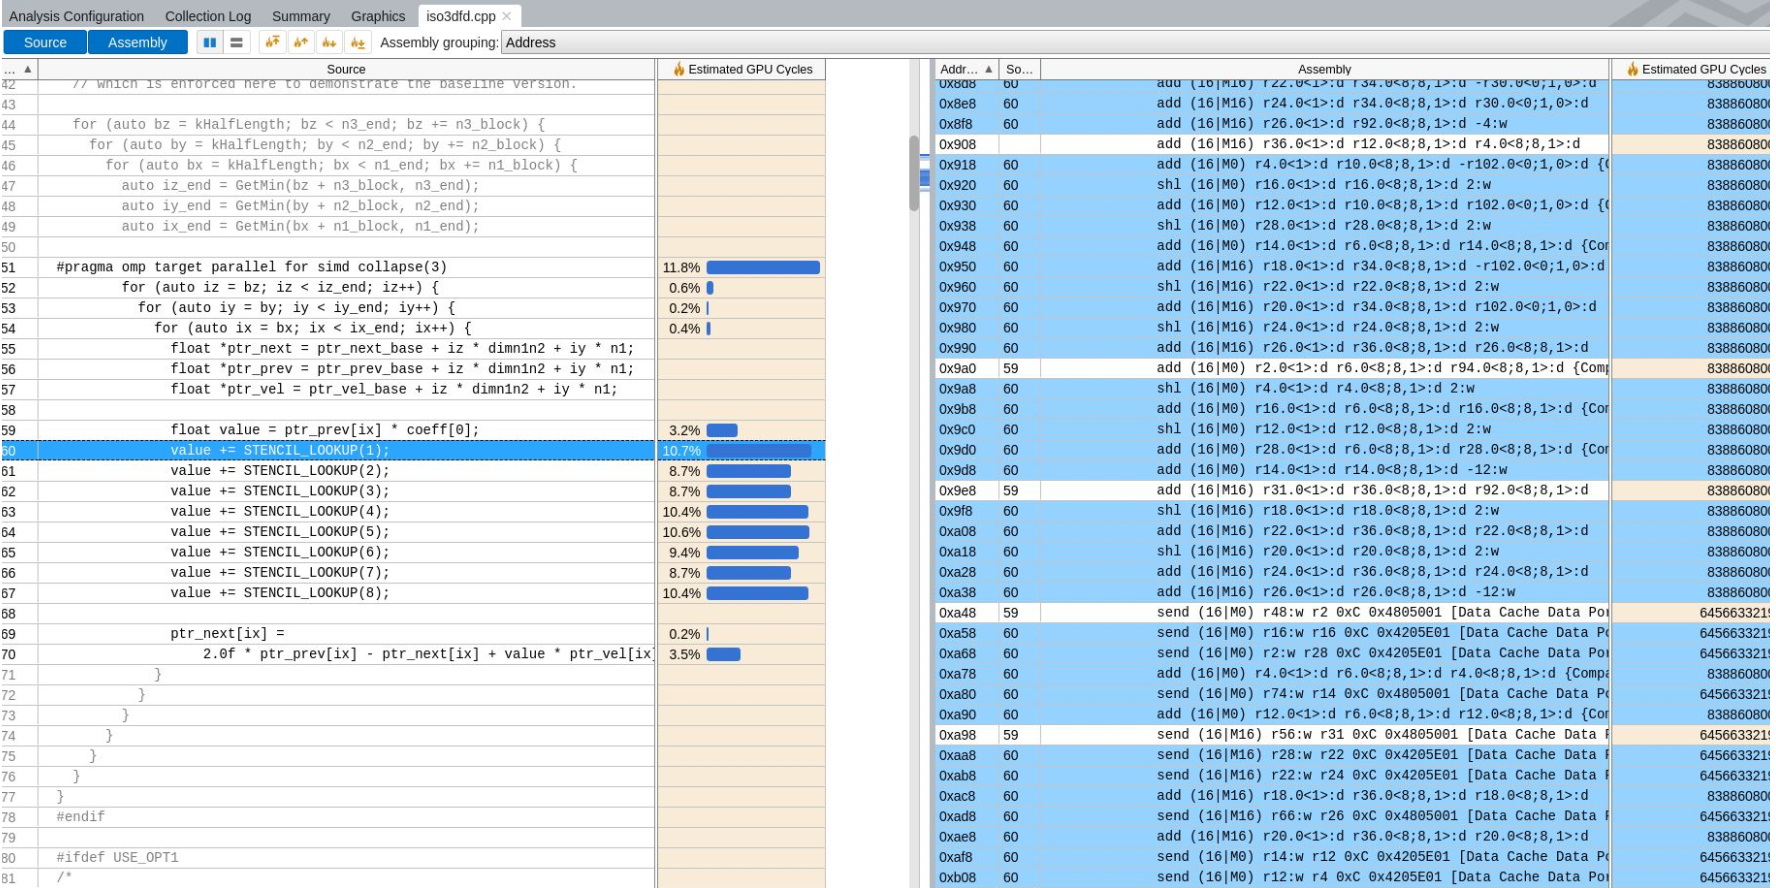
You can also analyze compute tasks at the source code level. For example, you can count GPU clock cycles spent on a particular task or due to memory latency. Use the Source Analysis option for this purpose.
Run Memory Latency Source Analysis from Command Line
To run the analysis with the Memory Latency Source Analysis option from the command line:
On Linux OS:
vtune -collect gpu-hotspots -knob profiling-mode=source-analysis -knob source-analysis=mem-latency -r iso_ghs_src-analysis_mem - ./src/iso3dfd 256 256 256 16 8 64 100
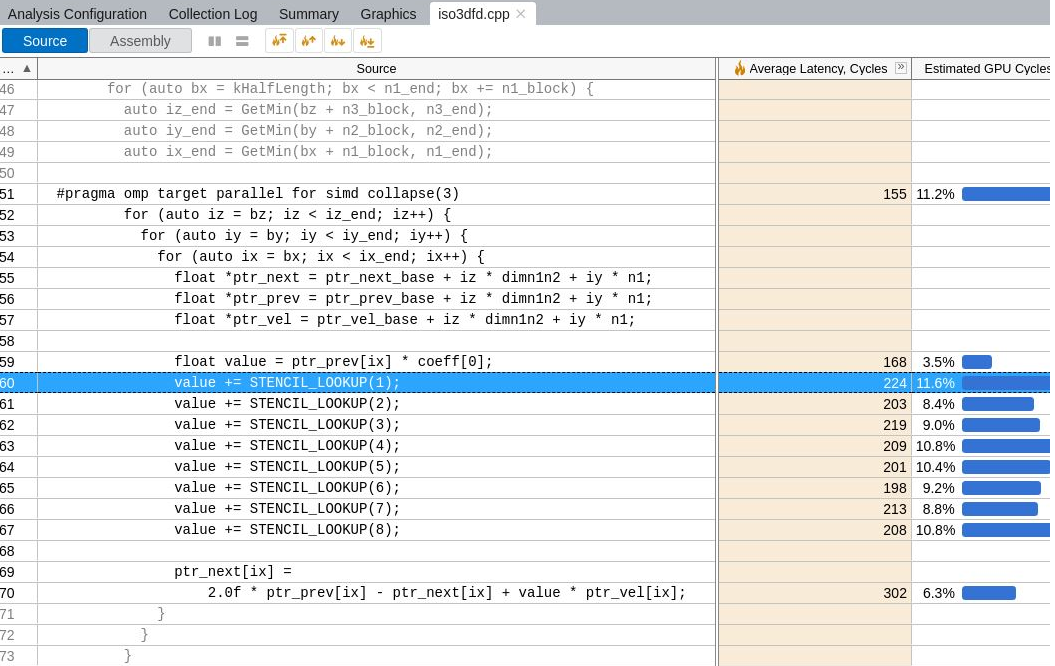
In the source view, examine the Average Latency Cycles for the offload kernel.
Generate a Hotspots Report With Source for a Computing Task From the Command Line
To generate a Hotspots report (with source for a computing task) from the command line, type:
vtune -report hotspots -source-object 'computing-task=Iso3dfdIteration$omp$offloading:50' -group-by=gpu-source-line -r <result>
Run Basic Block Latency Source Analysis from Command Line
To run the analysis with the Basic Blocks Latency Source Analysis option from the command line:
On Linux OS:
vtune -collect gpu-hotspots -knob profiling-mode=source-analysis -knob source-analysis=mem-latency -r iso_ghs_src-analysis – ./src/iso3dfd 256 256 256 16 8 64 100
In the source view, examine the Average Latency Cycles for the offload kernel.
Discuss this recipe in the VTune Profiler developer forum.
Parent topic: Configuration Recipes