This article describes the Data Plane Development Kit (DPDK) TestPMD application. It shows you how to build and configure TestPMD, and how to use it to check the performance and features of different network devices using DPDK.
TestPMD is one of the reference applications distributed with the DPDK package. Its main purpose is to forward packets between Ethernet ports on a network interface. In addition, it allows the user to try out some of the features of the different drivers such as RSS, filters, and Intel® Ethernet Flow Director.
We will also look at the TestPMD runtime command line which can be used to configure packet forwarding between ports and other features supported by the network interface. The TestPMD application works with all versions of DPDK.
Sample Setups for TestPMD
To demonstrate the use of TestPMD we will consider two typical hardware setups.
In the first setup, shown in Figure 1, the TestPMD application is used with two Ethernet ports connected to an external traffic generator. This allows the user to test throughput and features under different network workloads.

Figure 1. Setup 1 – With an external traffic generator.
In the second setup the TestPMD application is used with two Ethernet ports in a loopback mode. This allows the user to check the reception and transmission functionality of the network device without the need for an external traffic generator.
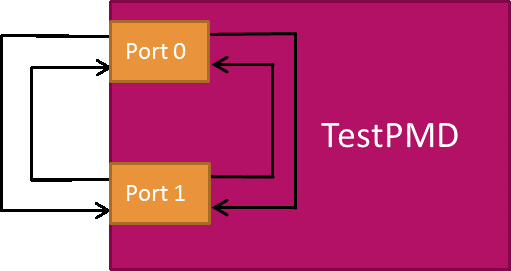
Figure 2. Setup 2 – TestPMD in loopback mode.
Forwarding Modes
TestPMD has different forwarding modes that can be used within the application.
- Input/output mode: This mode is generally referred to as IO mode. It is the most common forwarding mode and is the default mode when TestPMD is started. In IO mode a CPU core receives packets from one port (Rx) and transmits them to another port (Tx). The same port can be used for reception and transmission if required.
- Rx-only mode: In this mode the application polls packets from the Rx ports and frees them without transmitting them. In this way it acts as a packet sink.
- Tx-only mode: In this mode the application generates 64-byte IP packets and transmits them from the Tx ports. It doesn’t handle the reception of packets and as such acts as a packet source.
These latter two modes (Rx-only and Tx-only) are useful for checking packet reception and transmission separately.
Apart from these three modes there are other forwarding modes that are explained in the TestPMD documentation.
Compiling and Preparing TestPMD
The following steps are used to compile and set up the TestPMD application:
-
Compile DPDK from the source directory. This also compiles the TestPMD application:
$ make config T=x86_64-native-linuxapp-gcc $ make -
Initialize the kernel module uio:
$ sudo modprobe uio -
Insert the kernel module igb_uio:
$ sudo insmod ./build/kmod/igb_uio.ko -
Reserve hugepage memory for use by the DPDK TestPMD application. The easiest way to do this is by using the dpdk-setup.sh tool that comes with DPDK (refer to the DPDK Getting Started Guide for more information on this):
$ sudo ./usertools/dpdk-setup.sh -
Bind the network interface ports to igb_uio. For this example we will assume that the ports to be used have PCI addresses of 0000:83:00.1 and 0000:87:00.1:
$ sudo ./usertools/dpdk-devbind.py –b igb_uio 0000:83:00.1 0000:87:00.1
Running TestPMD
TestPMD can be run in non-interactive mode using a series of command-line parameters. It can also be run in interactive mode, using the -i option, to get a runtime command line. The runtime command line allows dynamic configuration of TestPMD:
$ sudo ./build/app/testpmd –l 12,13,14 –n 4 -- -iIn this example the -l option specifies the logical cores. Core 12 is used to manage the command line and cores 13 and 14 will be used to forward packets. The -n option is used to specify the number of memory channels for the system. The double dash separates the DPDK Environment Abstraction Layer (EAL) commands from the TestPMD application commands, in this case the -i option for interactive mode. When the application is run you will see some output like the following:
$ sudo ./build/app/testpmd –l 12,13,14 –n 4 -- -i

EAL: Detected 40 lcore(s)
EAL: Probing VFIO support...
EAL: PCI device 0000:83:00.0 on NUMA socket 1
EAL:   probe driver: 8086:10fb net_ixgbe
EAL: PCI device 0000:83:00.1 on NUMA socket 1
EAL:   probe driver: 8086:10fb net_ixgbe
EAL: PCI device 0000:87:00.0 on NUMA socket 1
EAL:   probe driver: 8086:10fb net_ixgbe
EAL: PCI device 0000:87:00.1 on NUMA socket 1
EAL:   probe driver: 8086:10fb net_ixgbe
Interactive-mode selected
USER1: create a new mbuf pool <mbuf_pool_socket_0>:
       n=163456, size=2176, socket=0
Configuring Port 0 (socket 0)
Port 0: 00:1B:21:B3:44:51
Configuring Port 1 (socket 0)
Port 1: 00:1B:21:57:EE:71
Checking link statuses...
Port 0 Link Up - speed 10000 Mbps - full-duplex
Port 1 Link Up - speed 10000 Mbps - full-duplex
Done
testpmd>
The testpmd> prompt allows the user to input commands. This is referred to as the runtime command line. For example, we can use this to check the forwarding configuration:
testpmd> show config fwd
io packet forwarding - ports=2 - cores=1 - streams=2
   - NUMA support disabled, MP over anonymous pages disabled
Logical Core 13 (socket 1) forwards packets on 2 streams:
  RX P=0/Q=0 (socket 0) -> TX P=1/Q=0 (socket 0) peer=02:00:00:00:00:01
  RX P=1/Q=0 (socket 0) -> TX P=0/Q=0 (socket 0) peer=02:00:00:00:00:00
This shows that TestPMD is using the default io forwarding mode, as described above. It also shows that core number 13 (which was the second core that we enabled from the ) is going to poll packets from port 0, forward them to port 1, and vice versa. The first core on the command line, 12, is being used to handle the runtime command line itself.
To start forwarding, just type in start:
testpmd> startThen, to check that traffic is being forwarded between the ports, run the following command to show the statistics for all the ports that the application is using:
testpmd> show port stats all

################### NIC statistics for port 0  ######################
  RX-packets: 8480274    RX-missed: 0          RX-bytes:  508816632
  RX-errors:  0
  RX-nombuf:  0
  TX-packets: 5763344    TX-errors: 0          TX-bytes:  345800320

  Throughput (since last show)
  Rx-pps:      1488117
  Tx-pps:      1488116
#####################################################################

################### NIC statistics for port 1  ######################
  RX-packets: 5763454    RX-missed: 0          RX-bytes:  345807432
  RX-errors:  0
  RX-nombuf:  0
  TX-packets: 8480551    TX-errors: 0          TX-bytes:  508832612

  Throughput (since last show)
  Rx-pps:      1488085
  Tx-pps:      1488084
 ####################################################################
This output shows the total number of packets handled by the application since the start of packet forwarding, with the number of packets received and transmitted by both ports. The traffic rate is displayed in packets per second (pps). In this example, all the traffic received at the ports is being forwarded at the theoretical line rate of 14.88 million pps. The line rate is the maximum speed for a given packet size and network interface.
To stop forwarding, simply type in stop. This stops the forwarding and displays the accumulated statistics for both ports, as well as an overall summary.
testpmd> stop

Telling cores to stop...
Waiting for lcores to finish...

------------------ Forward statistics for port 0  ----------------------
RX-packets: 136718750      RX-dropped: 0             RX-total: 136718750
TX-packets: 136718750      TX-dropped: 0             TX-total: 136718750
------------------------------------------------------------------------

------------------ Forward statistics for port 1  ----------------------
RX-packets: 136718750      RX-dropped: 0             RX-total: 136718750
TX-packets: 136718750      TX-dropped: 0             TX-total: 136718750
------------------------------------------------------------------------

+++++++++++ Accumulated forward statistics for all ports +++++++++++++++
RX-packets: 273437500      RX-dropped: 0             RX-total: 273437500
TX-packets: 273437500      TX-dropped: 0             TX-total: 273437500
++++++++++++++++++++++++++++++++++++++++++++++++++++++++++++++++++++++++
Using Multiple Cores
For cases where a single core is not enough to forward all of the incoming traffic, multiple cores can be used to handle packets from different ports.
In the previous example, cores 13 and 14 were available for forwarding packets, but only core 13 was used. To enable the other core we can use the following command:
testpmd> set nbcore 2

testpmd> show config fwd

io packet forwarding - ports=2 - cores=2 - streams=2
   - NUMA support disabled, MP over anonymous pages disabled
Logical Core 13 (socket 1) forwards packets on 1 streams:
  RX P=0/Q=0 (socket 0) -> TX P=1/Q=0 (socket 0) peer=02:00:00:00:00:01
Logical Core 14 (socket 1) forwards packets on 1 streams:
  RX P=1/Q=0 (socket 0) -> TX P=0/Q=0 (socket 0) peer=02:00:00:00:00:00
Now core 13 will receive packets from port 0 and transmit them on port 1, and core 14 will receive packets from port 1 and transmit them on port 0.
Changing the Forwarding Mode
As described above, TestPMD has different forwarding modes. To change the forwarding mode to Rx-only we can use the set fwd command:
testpmd> set fwd rxonly
testpmd> start
Now if we look at the port statistics we see that only the received packets are shown. Since there are no transmitted packets the Tx statistics remain at 0:
testpmd> show port stats all
################### NIC statistics for port 0  ######################
RX-packets: 524182888  RX-missed: 0          RX-bytes:  31450974816
RX-errors:  0
RX-nombuf:  0
TX-packets: 0          TX-errors: 0          TX-bytes:  0

Throughput (since last show)
Rx-pps:     14880770
Tx-pps:            0
#####################################################################

################### NIC statistics for port 1  ######################
RX-packets: 486924876  RX-missed: 0          RX-bytes:  29215494352
RX-errors:  0
RX-nombuf:  0
TX-packets: 0          TX-errors: 0          TX-bytes:  0

Throughput (since last show)
Rx-pps:     14880788
Tx-pps:            0
#####################################################################
Getting Help in TestPMD
TestPMD has online help for the commands that are available at run time. These are divided into sections and can be accessed using help.
testpmd> helpHelp is available for the following sections:
help control    : Start and stop forwarding.
help display    : Displaying port, stats and config information.
help config     : Configuration information.
help ports      : Configuring ports.
help registers  : Reading and setting port registers.
help filters    : Filters configuration help.
help all        : All of the above sections.
For example, to get help on the commands that display statistics and other information:
testpmd> help display
Display:
--------

show port (info|stats|xstats|fdir|stat_qmap|dcb_tc|cap) (port_id|all)
    Display information for port_id, or all.

show port X rss reta (size) (mask0,mask1,...)
    Display the rss redirection table entry indicated by masks on port X. size is used to indicate the hardware supported reta size

show port rss-hash ipv4|ipv4-frag|ipv4-tcp|ipv4-udp|ipv4-sctp|ipv4-other|ipv6|ipv6-frag|ipv6-tcp|ipv6-udp|ipv6-sctp|ipv6-other|l2-payload|ipv6-ex|ipv6-tcp-ex|ipv6-udp-ex [key]
    Display the RSS hash functions and RSS hash key of port X

clear port (info|stats|xstats|fdir|stat_qmap) (port_id|all)
    Clear information for port_id, or all.

show (rxq|txq) info (port_id) (queue_id)
    Display information for configured RX/TX queue.

show config (rxtx|cores|fwd|txpkts)
    Display the given configuration.

read rxd (port_id) (queue_id) (rxd_id)
    Display an RX descriptor of a port RX queue.

read txd (port_id) (queue_id) (txd_id)
    Display a TX descriptor of a port TX queue.
Conclusion
In this article we have looked at how to compile, set up, and run TestPMD and how to configure it through the runtime command line.
Additional Information
For more information on DPDK see the general DPDK documentation, and for more information on TestPMD itself, see the DPDK TestPMD Application User Guide.
See a video that covers the information in this article at Intel® Network Builders, in the DPDK Training course Testing DPDK Performance and Features with TestPMD. You may have to become a member of Intel Network Builders, which will give you access to a wide range of courses covering DPDK and other Networking topics.
About the Author
Pablo de Lara Guarch is a network software engineer with Intel. His work is primarily focused on development of data plane functions and libraries for DPDK. His contributions include hash algorithm enhancements and new crypto drivers. He also maintains the DPDK crypto subtree.