Overview
This article is primarily aimed at development engineers working on high-performance computing (HPC) applications. We will show an example of how we used Intel® VTune™ Amplifier to detect a performance bottleneck in Open vSwitch* (OvS) with Data Plane Development Kit (DPDK), also known as OvS-DPDK. We will also describe how we addressed this performance issue. If you are relatively new to design principles of OvS-DPDK packet processing, we highly recommend reading our previous introductory OVS-DPDK Datapath Classifier for a description of the datapath classifier fundamentals as well as our part two OvS-DPDK Datapath Classifier, where we emphasized the overall packet processing pipeline with detailed call graphs.
The primary focus of this article is on Intel® microarchitecture and particularly on the top-down analysis approach.
Introduction
To optimize the application for performance, it’s not necessary for a developer to be a performance expert but they should be proficient with their own application. Many aspects come into play when trying to improve application performance, ranging from hardware platform considerations, code design changes, and code fine-tuning to leverage microarchitecture features. A deep understanding of the code design and implementation becomes an essential requirement for an application developer to understand how the application is utilizing the available hardware resources. This can be achieved by acquiring a deeper knowledge of hardware microarchitecture and by using specialized profiling tools like VTune™ Amplifier.
Getting Started: The Top-Down Approach
One of the prominent performance tuning methodologies is the top-down approach. This approach has three stages: system tuning on the top, application tuning in middle, and microarchitecture tuning at the bottom. System tuning involves the hardware and operating system tuning, while application tuning includes better design, parallelization, and improving the efficiency of libraries. Microarchitecture is the last stage and involves careful selection of compiler flags, vectorization, and code refactoring w.r.t memory/cache optimizations as well as an understanding of CPU pitfalls, as depicted in Figure 1.
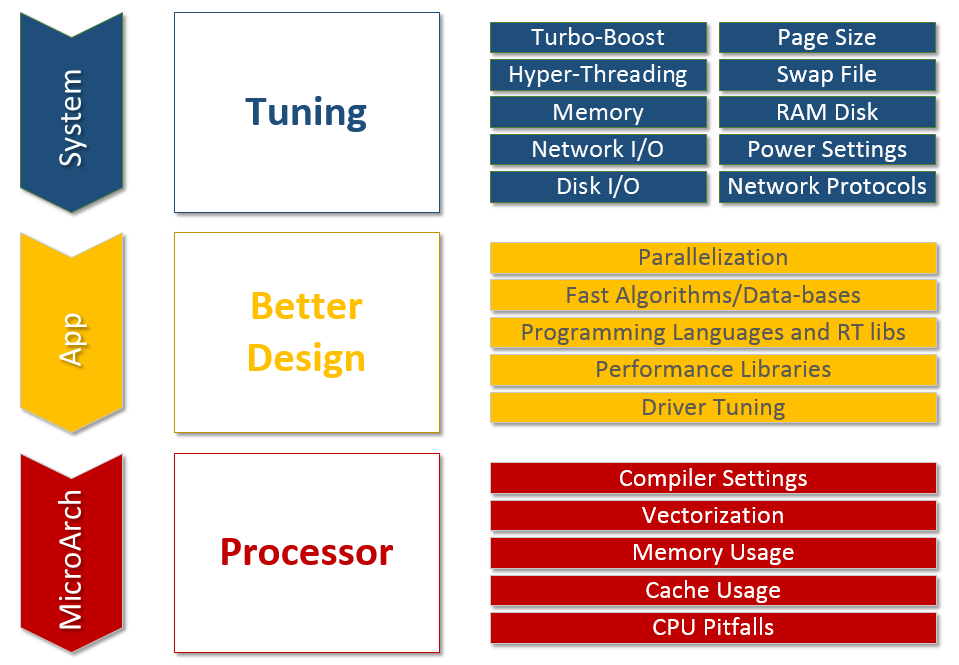
Figure 1. Top-down performance tuning approach.
The discussions that follow in the next sections will refer entirely to the microarchitecture stage.
Microarchitecture and Micro-Operations
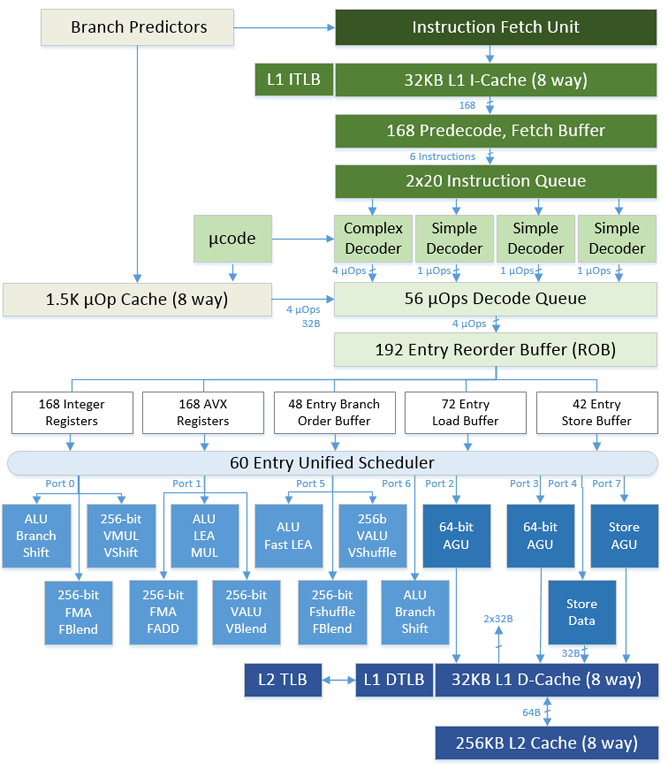
Figure 2. Intel® Core™ microarchitecture.
Figure 2 depicts the 4th generation Intel® Core™ microarchitecture, where the upper green portion is the front end and the lower blue portion is the back end of the pipeline. The front end is where the (macro) instructions – like ADD, MUL – are fetched and decoded (i.e., translated into smaller operations, called micro-operations [μ-Ops]). The back end is where the required operation, the actual computation, is carried out. Detailed description of each block of the pipeline is beyond the scope of this article. Figure 3 depicts the front-end and back-end processor pipeline responsibilities.
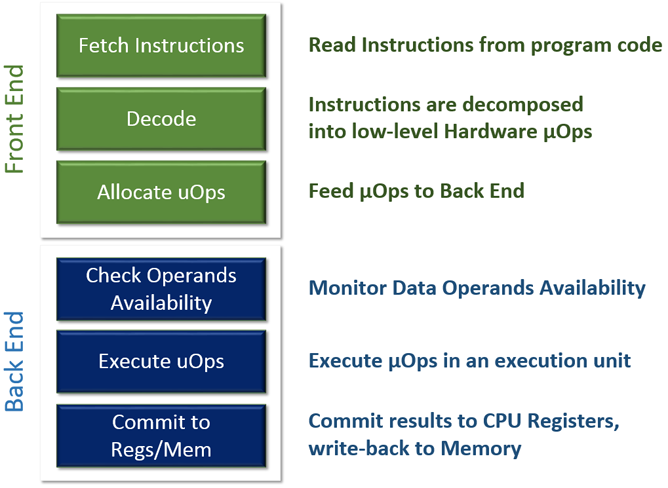
Figure 3. Front-end and back-end processor pipeline responsibilities.
Micro-operations (aka μOps) that successfully completed the whole datapath are considered to be “retired.” The back end can retire up to four μOps per cycle. μOps pass through the processor pipeline and retire; but occasionally, a few μOps that are speculatively fetched can get canceled in between due to various branch miss-predictions. A pipeline slot represents the hardware resources needed to process one μOp, meaning on a CPU core for each clock cycle four pipeline slots are available. As mentioned earlier, four μOps can be retired per cycle implying each instruction should take 0.25 cycles to retire in theory.
At a given point in time, a pipeline slot can be empty or filled with μOps. The pipeline slot is classified in four categories as depicted in Figure 4. More information on pipeline slot classification can be found in this Intel® VTune™ Amplifier 2019 User Guide.
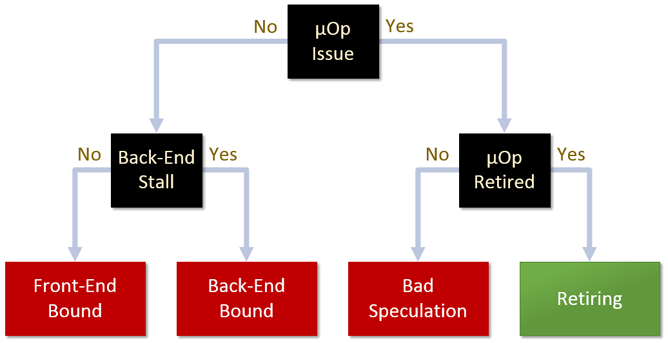
Figure 4. Pipeline slot classifications.
VTune™ Amplifier Tool
The VTune Amplifier collects measurements by leveraging performance monitoring units (PMUs) that are part of the CPU core. The specialized monitoring counters can collect and expose information on the hardware resource consumption. With the help of PMUs, the metrics regarding efficiency of the processed instructions and the caches usage can be measured and retrieved. It’s important to become familiar with the wide range of available metrics like retired instructions; clock ticks; L2, L3 cache statistics; branch mis-predicts; and so on. Also, “uncore” PMU metrics like bytes read/written from/to memory controller and data traffic transferred by Intel® QuickPath Interconnect (Intel® QPI) can be measured.
Below is the brief description and the formulas used to calculate the metrics of different pipeline slots. An application is considered front-end bound if the front end is delivering < 4 μOps per cycle while the back end is ready to accept more μOps. This is likely caused by delays in fetching code (caching/ITLB issues) or in decoding instructions. The front-end bound pipeline slot can be classified into sub-categories as depicted in Figure 5.
Formula: IDQ_UOPS_NOT_DELIVERED.CORE / (4 * Clockticks)
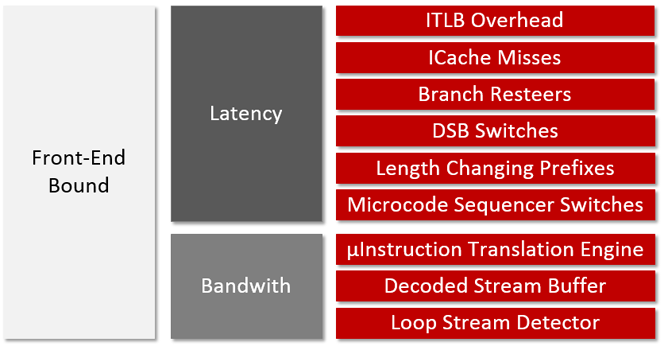
Figure 5. Front-end bound sub-categories.
The application is considered back-end bound if no μOps are delivered due to lack of required resources at the back end of the pipeline. This could be because internal structures are filled with μOps waiting on data. Further back-end bound sub-categories are depicted in Figure 6.
Formula: 1 - (Front-end Bound + Bad speculation + Retiring)
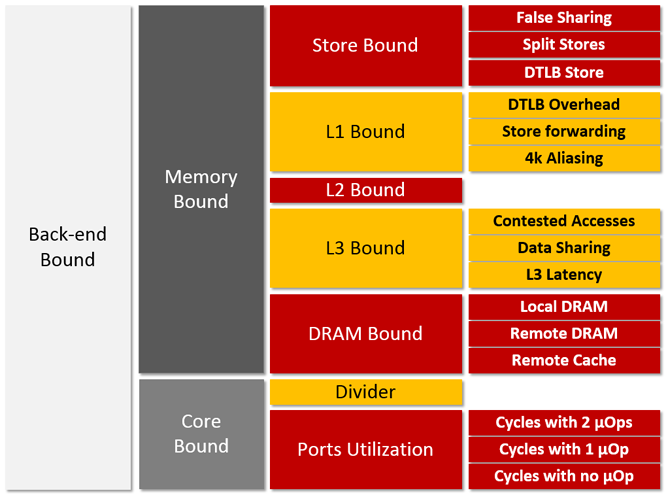
Figure 6. Back-end bound sub-categories.
As seen in Figure 7, the pipeline slot is classified as bad speculation when the μOps never retire or allocation slots were wasted, due to recovery from branch mis-prediction or machine clears.
Formula: (UOPS_ISSUED.ANY - UOPS_RETIRED.RETIRE_SLOTS + 4* INT_MISC.RECOVERY_CYCLES) / (4* Clockticks)

Figure 7. Bad speculation.
As seen in Figure 8, the pipeline slot is classified as retiring if the successfully delivered μOp was eventually retired.
Formula: UOPS_RETIRED.RETIRE_SLOTS / (4 * Clockticks)

Figure 8. Retiring.
The detailed description of each sub-category is beyond the scope of this article. Refer to “CPU Metrics Reference” for in-depth descriptions of each sub-category.
Analyzing OvS-DPDK Bottlenecks
Now that we have discussed the microarchitecture fundamentals, let’s apply the knowledge in analyzing the bottlenecks in OvS-DPDK.
Batching Packets by Flows
One of the important packet pipeline stages in OvS-DPDK is the flow batching. Each incoming packet is first classified and then batched depending on its matching flow, as depicted in Figure 9.
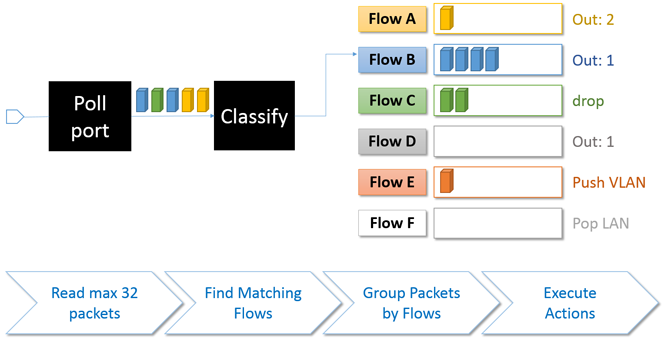
Figure 9. Packet are grouped depending on the matching flow.
The packets queued into a batch shall be processed with a corresponding list of actions (drop, push/pop VLAN) defined for that flow. To improve the packet forwarding performance the packets belonging to the same flow are batched and processed together.
Occasionally, there could be few packets in a batch. In the worst case, each of the fetched packets is matching a different flow, so each batch will contain a single packet. When the corresponding action for the flow is to forward packets to a certain physical port, transmitting a few packets can be very inefficient as packet transmission over a DPDK interface incurs expensive memory-mapped I/O (MMIO) writes.
Figure 10 shows the packet processing call graph. In exact match cache processing, for every input packet a lookup is performed in EMC to retrieve matching flow. In case of an EMC hit, the packets are queued into batches — see struct packet_batch_per_flow in OvS-DPDK source code — matching the flow using dp_netdev_queue_batches(). Thereafter, packets are processed in batches for faster packet processing using packet_batch_per_flow_execute. If the corresponding action of the flow is to forward the packets to a DPDK port, netdev_send will be invoked, as depicted in Figure 10.
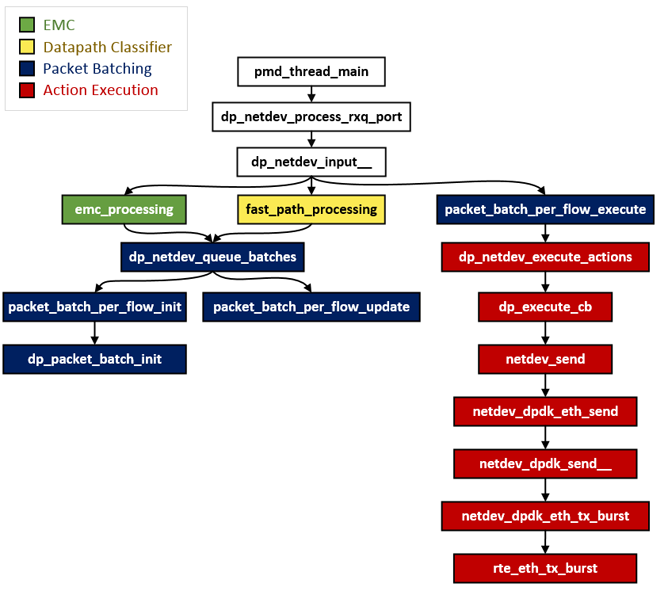
Figure 10. OvS-DPDK call graph for classification, flow batching and forwarding.
Benchmark with 64-byte UDP Packets
A benchmark was set up with an Ixia* Traffic Generator sending a few dozen unique streams comprising 64-byte UDP packets. Significant performance drop is observed with tens of different flows in “PHY2PHY” test case. Note that the flow rules are unique and are set up to match on source IP address of the packets for a corresponding stream. Example flow rules are shown below; this will create four batches and the packets are queued to corresponding batches.
$ ovs-ofctl add-flow br0 in_port=4,dl_type=0x0800,nw_src=2.2.2.1,actions=output:2
$ ovs-ofctl add-flow br0 in_port=4,dl_type=0x0800,nw_src=4.4.4.1,actions=output:2
$ ovs-ofctl add-flow br0 in_port=4,dl_type=0x0800,nw_src=6.6.6.1,actions=output:2
$ ovs-ofctl add-flow br0 in_port=4,dl_type=0x0800,nw_src=8.8.8.1,actions=output:2
With the above flow rule, VTune general exploration analysis revealed interesting insights into transmission bottlenecks in OvS-DPDK.
VTune Amplifier Summary
When general exploration analysis is run for a 60-second duration, Figure 11 shows the snapshot of the VTune Amplifier summary on how the pipeline slots are occupied. Note that the slots highlighted pink need attention and are auto highlighted by VTune based on the default thresholds of the application category.
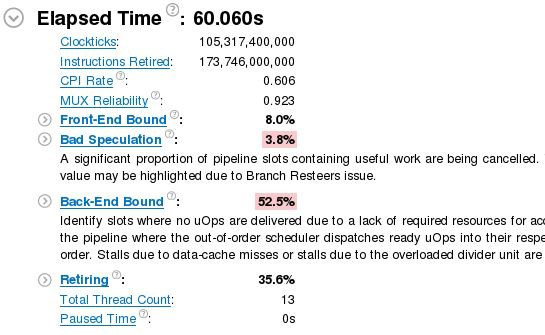
Figure 11. Summary of the general exploration analysis provided by VTune™ Amplifier.
According to VTune documentation, Table 1 shows the comparison between the expected range of pipeline slots in healthy high-performance computing applications with the OvS-DPDK results as output by VTune Amplifier.
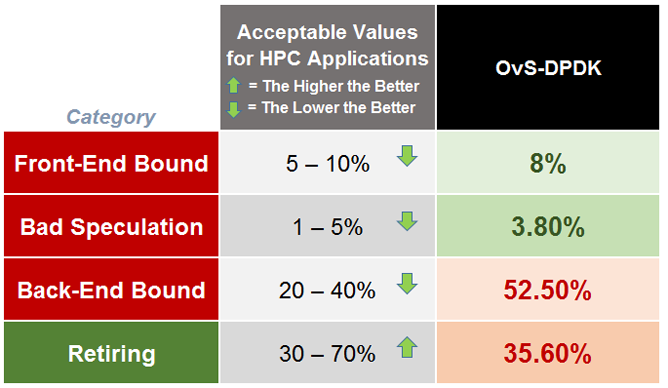
Table 1. Expected vs. measured ranges of pipeline slots.
As seen in the table, for the particular test case, OvS-DPDK is back-end bound and is retiring (only 35%) far less instructions than the expected and healthy 70% limit. A bottom-up analysis revealed a few interesting details, as depicted in Figure 12.
netdev_dpdk_eth_send()consumed 17% of the total cycles.- The cycles per instruction (CPI) rate for the above function stands at 4.921, much higher than the theoretical limit 0.25 and acceptable range of 1.0 in case of HPC applications.
- This function is entirely back-end bound and is hardly retiring any instructions (<6%).
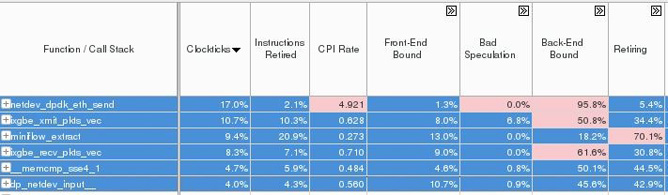
Figure 12. Summary of the general exploration analysis provided by VTune™ Amplifier.
Let’s see in more detail what’s happening in the back-end pipeline by expanding the back-end Bound column. Figure 13 depicts where exactly the bottleneck is in the back-end pipeline and it points to a significant issue in L1 cache.
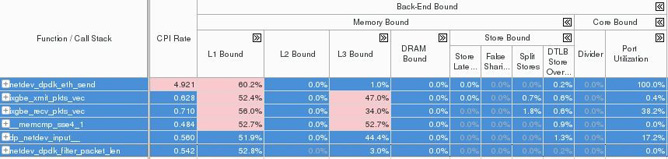
Figure 13. Back-end bound summary.
The listed functions are dealing with the transmission of the packets. This may imply that the back-end pipeline is suffering a long latency for I/O operations. So the bottleneck may possibly be due to the costly MMIO transactions. That’s especially true when the processed packets – 32 at the most – are matching many different flows. In the worst-case scenario where each packet is hitting a different flow, an MMIO operation will be triggered for transmitting each packet from the corresponding batch.
Solution to Mitigate MMIO Cost
In a real scenario, packets coming from a physical port may hit a large number of flows resulting in grouping very few packets for each flow batch. This becomes very inefficient when packets are transmitted over DPDK interfaces. To amortize the cost of MMIO writes, an intermediate queue can be used to queue "NETDEV_MAX_BURST" (i.e., 32) packets and transmit the packets in burst with rte_eth_tx_burst. The intermediate queue is implemented using the ‘netdev_dpdk_eth_tx_queue()’ function that will queue the packets. Packets will be transmitted when one of the conditions below are met.
- If packet count in txq
(txq->count) >= NETDEV_MAX_BURST, invokenetdev_dpdk_eth_tx_burst()to burst packets. - After a timeout elapses, any packet waiting into the queue must be flushed, regardless of its number.
With this solution, an improvement in both back-end and Retiring categories can be observed, as shown in Table 2.
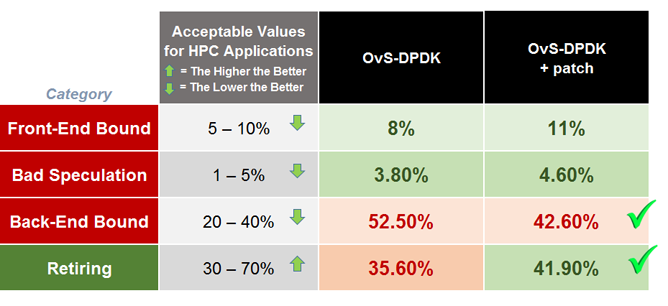
Table 2. Measured ranges of pipeline slots with and without the patch.
Figure 14 shows that after applying the patch, the function netdev_dpdk_eth_send() drastically moved from the top to the very bottom of the list. By mitigating the effect of MMIO latency the measured CPI went from 4.921 down to 1.108.
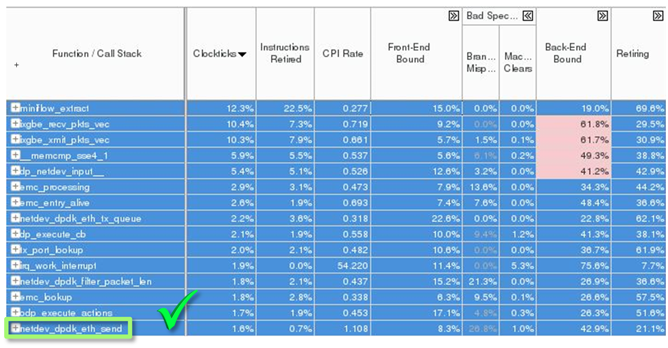
Figure 14. Effect of MMIO mitigation by the intermediate queue.
Please note that the performance can be further improved with more optimization in the packet transmission path; however, this is beyond the scope of this article. The above is an example to understand and fix the bottlenecks in a HPC application using VTune Amplifier. In our analysis using VTune Amplifier, we used the general exploration mode and focused on back-end bound metrics. It’s worth noting that other analysis types are available in the VTune Amplifier tool like the hotspot, advanced hotspot modes, hpc-performance, memory-access, and locks and waits. Also, other metrics are available to show resource consumption.
Conclusions
In this article we described the top-down methodology to analyze and detect performance bottlenecks. Also we focused on explaining the VTune Amplifier metrics in context of microarchitecture. An application example is used (i.e., OvS-DPDK) to identify and find the root cause of the bottlenecks and the steps taken to improve the performance.
Additional Information
For any questions, feel free to follow up with the query on the Open vSwitch discussion mailing thread.
Articles
OvS-DPDK Datapath Classifier – part 2
About the Authors
Bhanuprakash Bodireddy is a network software engineer at Intel. His work primarily focuses on accelerated software switching solutions in user space running on Intel® architecture. His contributions to OvS-DPDK include usability documentation, the Keep-Alive feature, and improving the datapath classifier performance.
Antonio Fischetti is a network software engineer at Intel. His work primarily focuses on accelerated software switching solutions in user space running on Intel architecture. His contributions to OvS-DPDK are mainly focused on improving the datapath classifier performance.
"