Intel® Inspector Simplifies Debugging of Heterogeneous Parallel Code
Kevin O’Leary, lead technical consulting engineer,
and Michael Tutin, software architect, Intel Corporation
@IntelDevTools
Get the Latest on All Things CODE
Sign Up
Modern workloads are diverse and so are architectures. No single architecture is best for every workload. Maximizing performance takes a mix of scalar, vector, matrix, and spatial architectures deployed in CPUs, GPUs, FPGAs, and other future accelerators. Heterogeneity adds complexity that can be difficult to debug. This article introduces the new features of Intel® Inspector that support the analysis of code that is offloaded to accelerators.
Intel Inspector Overview
Memory errors and nondeterministic threading errors are difficult to find without the right tool. Intel Inspector is designed to find these errors. It is a dynamic memory and threading error debugger for C, C++, Data Parallel C++ (DPC++), and Fortran applications that run on Windows* or Linux* operating systems.
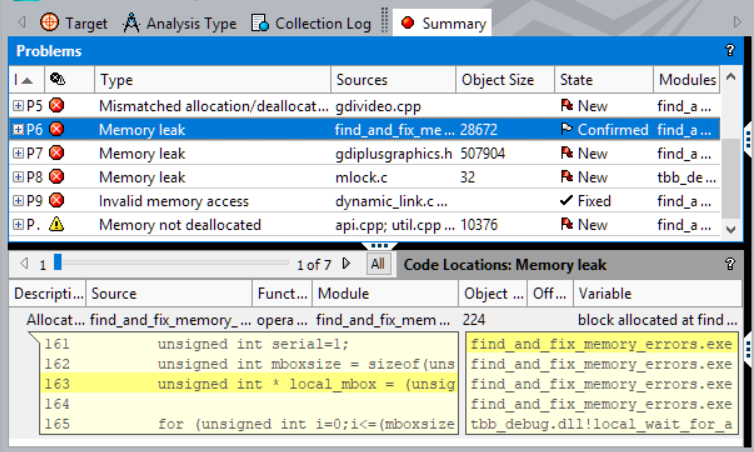
Figure 1. Types of problems that Intel Inspector identifies
Intel Inspector identifies these issues:
- Memory errors including leaks and invalid access
- Persistent memory errors such as missing or redundant cache flushes
- Threading errors such as data races and deadlocks
Intel Inspector is easy to use, reliable, and accurate. It does not require a special recompilation. You can use your normal debug or production build to catch and debug the errors. Intel Inspector can analyze dynamically generated or linked code and inspect third-party libraries, even when source code is not available. It breaks into the debugger just before the error occurs. Automated regression analysis is possible using the command-line option.
How to Analyze Your Offloaded Code Using Intel Inspector
Correctness analysis is more complicated when you offload code to an accelerator. Experiences with DPC++ uncovered the need for a tool to assist in debugging offload issues. The current version of Intel Inspector introduces an important approach called, early interception. It means that for an offloaded code, Intel Inspector intercepts some problems in the early stages before running the kernel. Tables 1 and 2 list the offload issues that you can detect using Intel Inspector. Data races on shared data are reported, but there are limitations:
- DPC++ barriers and OpenMP* synchronizations are ignored. The tool reports false positives even if work items are synchronized.
- Data races are not detected on variables defined in kernel local memory.
The following instructions set up your application to run on your CPU, but some GPU analysis is supported using early interception.
Step 1
Configure your application to run on the host CPU.
export SYCL_BE=PI_OPENCL
export SYCL_DEVICE_TYPE=CPU
Configure OpenMP applications to run kernels on the CPU device.
export OMP_TARGET_OFFLOAD=MANDATORY
export LIBOMPTARGET_DEVICETYPE=cpu
Verify that the application works correctly before running the analysis. Enable code analysis and tracing in the JIT compiler and runtimes.
export CL_CONFIG_USE_VTUNE=True
export CL_CONFIG_USE_VECTORIZER=false
Set up the Intel Inspector environment.
source /opt/inspxe/inspxe-vars.sh
Step 2
Run an analysis on a small workload using either the GUI (inspxe-gui) or command-line (inspxe-cl) clients.
To perform analysis using the command-line client:
inspxe-cl -c mi3 -- <app> [app_args]
View the results as follows.
inspxe-cl -report=problems -report-all
Alternatively, you can launch an analysis and view the results in the GUI.
inspxe-gui <result folder>
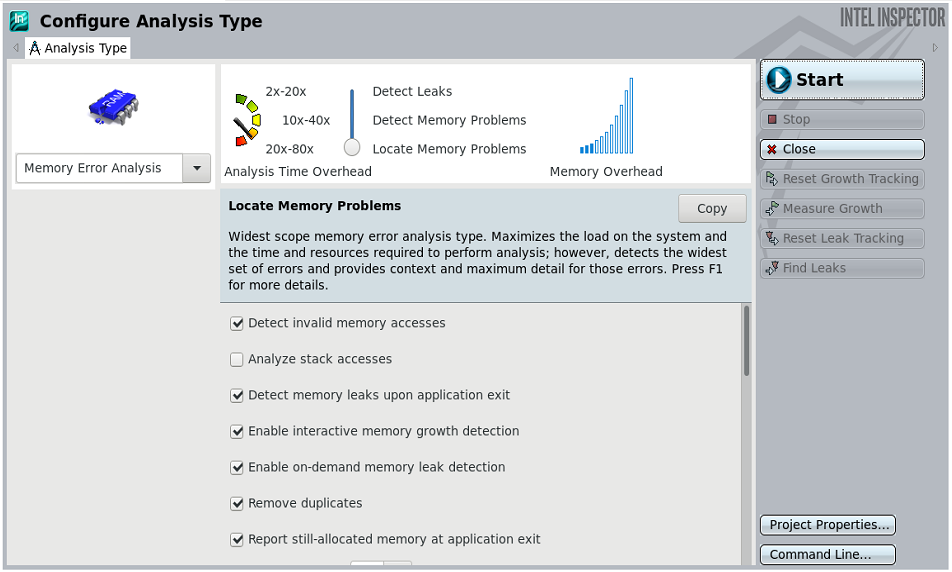
Figure 2. Perform an analysis using the GUI
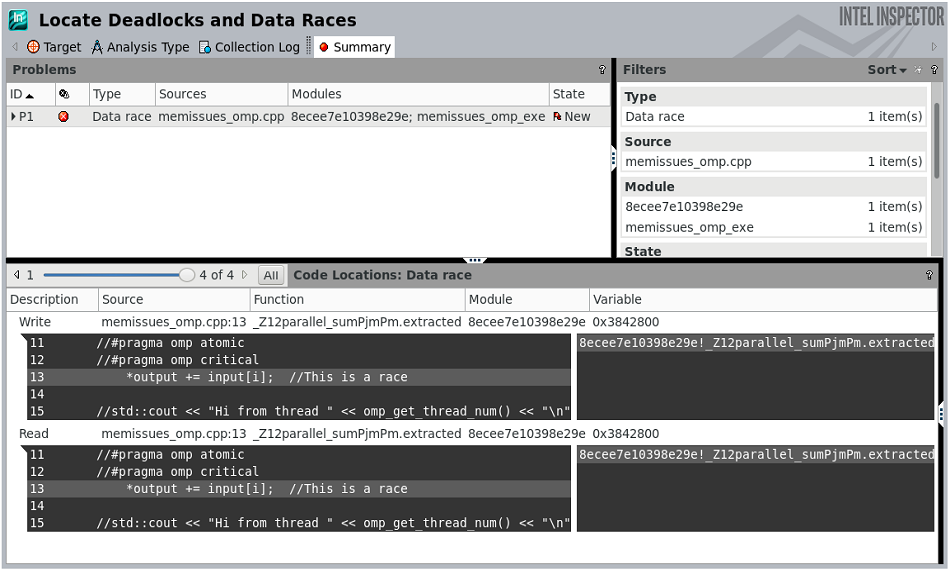
Figure 3. View results in the GUI
Example: Use a Host Pointer on the Device
The following code contains a memory problem.
//	... queue initialization code
const size t_size = 10;
uint32_t* array = new uint32_t [size];
uint64_t* result = new uint64_t;
// ... array initialization code
queue.submit ([&] (cl::sycl::handler &cgh)
{
    uint64_t* output = result;	// here we use directly local host variable
for output
    cgh.parallel_for<class my_task>(cl::sycl::range<l> { size },
[=](cl::sycl ::id<l> idx)
        {
            output[O] += array [idx];	// here we use directly the array from
host
        });
});
queue .wait();
Launch this code using the Intel Inspector command-line client and view the analysis results in the GUI (Figure 4).
$	inspxe-cl -c mi3 -- ./use_host_on_device

Collection started. To stop the collection, either press CTRL-C or enter from
another console window : inspxe-cl -r /tmp/mtutin/r000mi3 -command stop.
> RUNNING ON: Intel (R) Xeon(R) Gold 6152 CPU @ 2.l0GHz
> Initialize array on host: ptr=0x2e3dlc0
> Result: ptr=0x7ffc7a072310
> Starting kernel 1
> Done. Result=0xla69f00
Elapsed: 116.516 sec

83 new problem(s) found
    1 A host pointer is used on a device problem(s) detected
    1 Invalid deallocation problem(s) detected
    64 Invalid memory access problem(s) detected
    15 Invalid partial memory access problem(s) detected
    2 Memory leak problem(s) detected
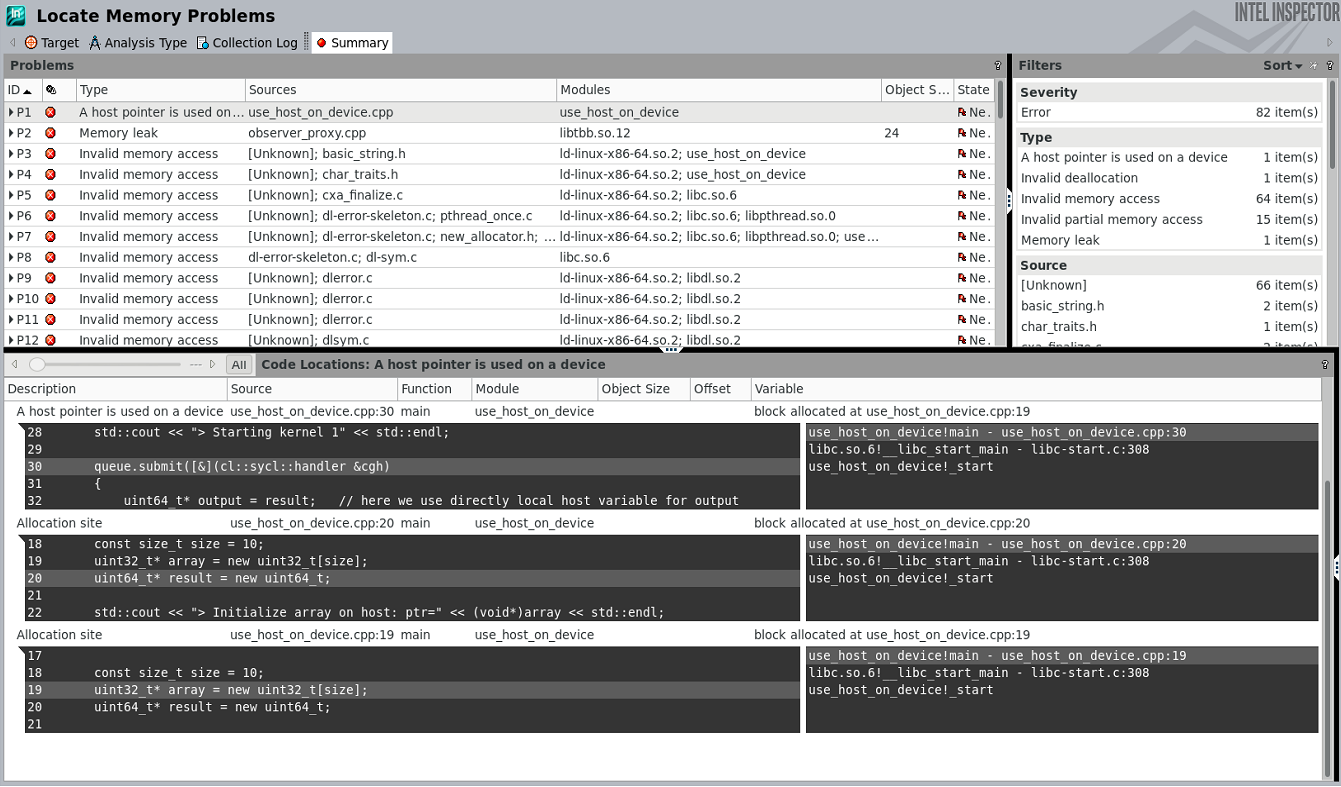
Figure 4. Launch analysis in the command-line client and view results in the GUI to locate memory problems
Example: Find a Data Race
The following code contains a race condition.
void parallel_sum(uint32_t* input, size_t size, uint64_t* output)
{
    *output = O;
    #pragma omp target device(O) map(to:input[O:size]) map{tofrom:output[O:l])
    #pragma omp parallel for
    for(size_t i=O;i<size;i++)
    {
       //#pragma omp atomic
       *output += input[i];
    }
}
Launch this code using the Intel Inspector command-line client and view the analysis results in the GUI (Figure 5).
$ inspxe-cl -c ti3 -- ./mem issues_omp_exe

Collection started. To stop the collection, either press CTRL-C or enter from
another console window: inspxe-cl -r /tmp/memissues_omp_exe/r002ti3 -command
stop.
> RUNNING ON: device no = 0
> Starting kernel
> output ptr = Oxbf4880
> Done. Result=433998319470 Expected=250000
Elapsed: 72.9886 sec

1 new problem(s) found
    1 Data race problem(s) detected
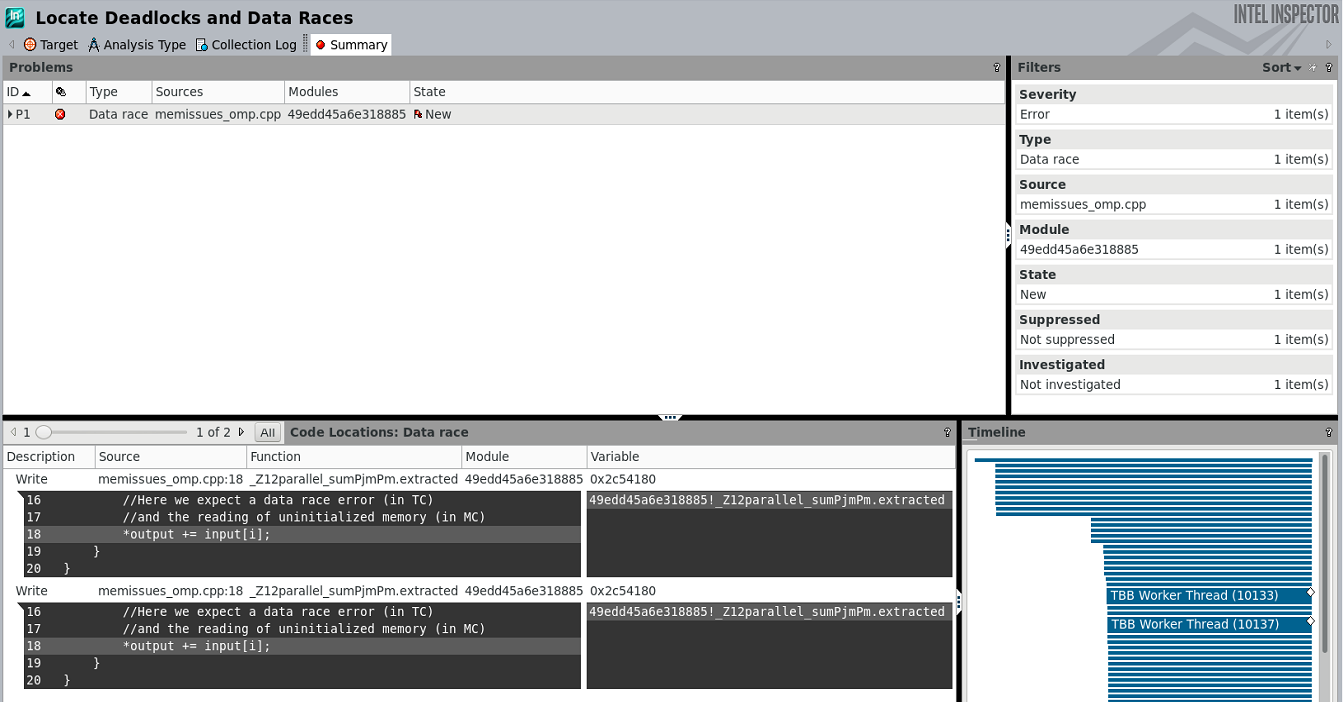
Figure 5. Launch analysis in the command-line client and view results in the GUI to locate data races
Table 1. Memory issues that Intel Inspector can detect.
| Problem Class | Example | Supports Early Interception? |
|---|---|---|
| Memory leak | clBuff = clCreateBuffer(...) //clReleaseMemObject(clBuff) |
Yes |
| Invalid deallocation | ptr = malloc(...) clBuff = clCreateBuffer(USE_HOST PTR, ptr, ...) //clReleaseMemObject(clBuff) free(ptr); |
Yes |
| Uninitialized read | ptr = malloc(...) read of clBuff (in the kernel) |
No |
| Invalid access | ptr = malloc(...) clBuff = clCreateBuffer(USE_HOST_PTR , ptr, ...) clReleaseMemObject(clBuff) and/or free (ptr) read\write of clBuff (in the kernel) |
No |
| Missing allocation | clReleaseMemObject(ptr) //release invalid handle //here OCL will throw an exception |
Yes |
| Invalid arguments | bl = clCreateBuffer(NULL, CL_MEM_COPY_HOST_PTR) b2 = clCreateBuffer(random_ptr, CL_MEM_COPY_HOST_PTR) |
Yes |
| Invalid buffer region | uint32_t* array = new uint32_t[1024]; cl::sycl::buffer<uint32_t, 1> inputBuf(array + 512, 1024); queue.submit([& ] (cl::sycl::handler &cgh) { |
Yes |
Table 2. Data races that Intel Inspector can detect.
| Problem Class | Example |
|---|---|
| Data race | cgh.parallel_for(...){ if(idx.get(0) > 0 && idx.get(0) < ArraySize - 1) { uint32_t s = array2_acc[idx-1] + array2_acc[idx] + array2_acc [idx + 1]; array2_acc[idx] = (s / 3) % ArraySize; } )}; |
Conclusion
oneAPI provides a standard, simplified programming model that can run seamlessly on the scalar, vector, matrix, and spatial architectures deployed in CPUs and accelerators. It gives users and domain experts the freedom to focus on the code itself and not the underlying mechanism that generates the best possible machine instructions. Correctness analysis tools like Intel Inspector provide assistance in debugging difficult-to-detect threading and memory issues.
References
______
You May Also Like
| Intel® Inspector Locate and debug threading, memory, and persistent memory errors early in the design cycle to avoid costly errors later. Intel® Inspector is included as part of the Intel® oneAPI HPC Toolkit. Get the toolkit to analyze, optimize, and deliver applications that scale. Get It Now Get Intel Inspector Only |