This document describes the traditional scenario for using the Roofline feature of Intel® Advisor. The Roofline analysis can be run from the command line, the standalone Advisor GUI, or the integrated Microsoft* Visual Studio* plug-in GUI. Note that using the Roofline in 2017 Update 1 has some additional steps.
Collect Data on the Command Line
- Set up your environment by running advixe-vars.bat (on Windows*) or sourcing advixe-vars.sh (on Linux*). These are located in the installation directory of Intel Advisor.
- Collect your Roofline data.
- For version 2018 Update 1 and later:
Roofline requires data from both the survey and trip counts with flops analysis types. You can choose to run these analyses separately or use a shortcut command that will run them one after the other. To enable callstack collection, add the -stacks flag to your roofline or tripcounts collection command.advixe-cl -collect=roofline -project-dir=MyResults -- MyExecutableadvixe-cl -collect=survey -project-dir=MyResults -- MyExecutable advixe-cl -collect=tripcounts -flop -project-dir=MyResults -- MyExecutable - For version 2018 Initial Release and older:
Roofline data requires both a survey and trip counts with flops analysis to be run.advixe-cl -collect=survey -project-dir=MyResults -- MyExecutable advixe-cl -collect=tripcounts -flops-and-masks -project-dir=MyResults -- MyExecutable
Note for MPI Applications: Survey and Trip Counts must be run separately on MPI applications. See this article for more information.
- For version 2018 Update 1 and later:
Collect Data in the GUI
- Launch Advisor. The standalone GUI can be opened from your window manager or by running the advixe-gui executable on the command line. The Microsoft* Visual Studio* plug-in can be launched using the
 button in the Visual Studio* interface.
 - Create and configure your project as needed.
- In the Microsoft* Visual Studio* integrated version, a project is created and configured automatically on launching Advisor. The Project Properties can be edited by selecting the "Intel Advisor Project Properties" option from the Project dropdown menu.
- In the standalone GUI, selecting New Project or the
 button will create a new project. The Project Properties will be opened automatically, where you can set the location of your executable, binaries, and source files.
- Open the vectorization workflow if using the standalone GUI using the
 button. The Microsoft* Visual Studio* plug-in automatically opens to the workflow.
 - Run the Roofline analysis. This consists of a Survey followed by a Trip Counts with FLOPS analysis. You can either run these manually (with FLOPS checkbox checked when launching the Trip Counts analysis) or use the shortcut Roofline button that runs then both for you. To enable callstack collection, check the callstacks checkbox under the Roofline button.
View Results in the GUI
- If you used the Roofline button in the GUI, the Roofline results will open automatically upon analysis completion.
- If you ran the Survey and Trip Counts collection separately in the GUI, click the gray "Roofline" ribbon to the left of your survey results to switch to the Roofline results.
- If you collected your data on the command line, open your results with:
advixe-gui MyResults
The Roofline chart is highly customizable. Detailed information about the various interface controls can be found in the Advisor User Guide.
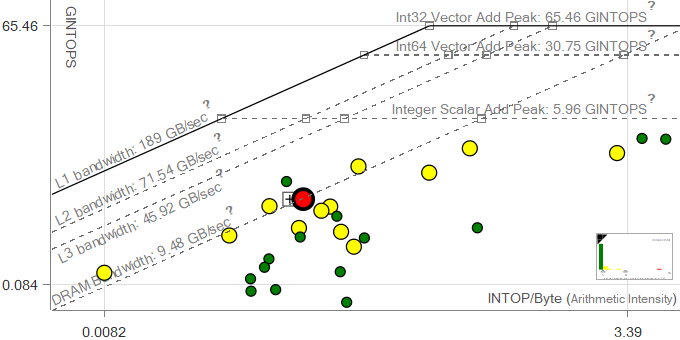
On the chart you can see different rooflines available on your machine: memory/cache bounds and compute bounds. Those rooflines are obtained dynamically by running a small benchmark prior to running your application. Memory/cache rooflines define a performance ceiling if the data cannot fit into that particular cache. The compute rooflines show compute performance bounds if scalar, single/double precision vector, or FMA computations are used.
For every hot loop in your program, analyse the loop position in the roofline plot. The hottest loops in the plot are displayed as large and red. Identify performance gaps and opportunities for each loop. Use other information and recommendations provided by Advisor to improve the performance of your application. Selecting a particular loop on the roofline plot causes that loop's information to be displayed in the tabs of the bottom pane, such as the source tab. It also highlights them on the survey report page.
Hint: If you have nested loops in nested routines, changing the filtering mode to “Loops And Functions” can be helpful because only the selftime FLOPS metric is calculated. To analyse FLOPS data for outer loops, all nested loops and functions calls should be carefully reviewed. For more information on this topic refer to the Selftime-based FLOPS computing article.
If you have any questions or problems please contact the Advisor team by email at vector_advisor@intel.com.
Additional Instructions for 2017 Update 1: Before opening the GUI or collecting or viewing data in this version, you must set the environment variable ADVIXE_EXPERIMENTAL=roofline in order to activate the roofline feature, which was still experimental at this point.
Additionally, if collecting data from the GUI, you must check the "Collect information about FLOPS, L1 memory traffic, and AVX-512 mask usage" checkbox in the Trip Counts tab of the Project Properties, because there is no FLOPS checkbox in the workflow interface.