Vectorization promises to deliver as much as 16 times faster performance by operating on more data with each instruction issued. The code modernization effort aims to get all software running faster by scaling software to use more threads, processes, and just as importantly effectively vectorize, that is, effectively use single instruction, multiple data (SIMD) execution units. This article provides some background on vectorization and discusses techniques to evaluate its effectiveness.
Introduction
For the purposes of this article, SIMD and vectorization are used synonymously. Today’s computers are doing more and solving more problems than ever before. Each new generation of computers changes significantly—today’s computers look very different from those delivered 20 years ago. As computers continue to change, software needs to change as well. Just as modern Intel® processors build on top of the core instruction set architecture (ISA), software can also continue to build on top of traditional C/C++ and Fortran*. Intel’s instruction set expanded to add Intel® Streaming SIMD Instructions 4 (Intel® SSE4), Intel® Advanced Vector Extensions (Intel® AVX), and Intel® Advanced Vector Extensions 512 (Intel® AVX-512); as such, software needs to use vectorization efficiently.
Modern processors continue to add more cores to each processor and to widen the SIMD extensions. Software is threaded to take advantage of the numerous cores on Intel® platforms. Just as the number of cores in a processor increased from two full cores to 16, and up to over 50 cores per processor on the Intel® Xeon Phi™ processor product family, the width of the SIMD data registers increased. The original Intel SSE instructions operated on registers 128-bits wide. The Intel AVX instructions were introduced with the addition of the 256-bit registers and Intel AVX-512 brings 512-bit registers to Intel platforms. With 512-bit registers the processor can operate on 8 to 16 times the amount of data with a single instruction compared to the original 64-bit registers.
This is the importance of vectorization. If software doesn’t embrace vectorization, it is not keeping up with the new instructions available, which is somewhat similar to operating on old Intel platforms. Table 1 shows Intel AVX-512 instructions performing eight data operations with one instruction.
| zmm2 | a[0] | a[1] | a[2] | a[3] | a[4] | a[5] | a[6] | a[7] |
| zmm3 | b[0] | b[1] | b[2] | b[3] | b[4] | b[5] | b[6] | b[7] |
| zmm1 | a[0]+b[0] | a[1]+b[1] | a[2]+b[2] | a[3]+b[3] | a[4]+b[4] | a[5]+b[5] | a[6]+b[6] | a[7]+b[7] |
Table 1: An example of Intel® Advanced Vector Extensions 512 (VADDPD) and data operations.
The SIMD registers may be fully packed as shown above, or it may operate on only a single lane (packed versus scalar instructions). Table 1 shows a packed operation or all eight lanes full and being operated on simultaneously. When only one lane of a SIMD register is used, this is just a scalar operation. The goal of vectorization is to move software from scalar mode to full width—or packed vectorization—mode.
So how does a software developer go from scalar code to vector mode? Consider these vectorization opportunities:
- Use vectorized libraries
- Think SIMD
- Performance analysis and compiler reports
Use Vectorized Libraries
This is the simplest method to benefit from vectorization or SIMD operations. There are many libraries optimized that take advantage of the wide SIMD registers. The most popular of these is the Intel® Math Kernel Library (Intel® MKL). Intel MKL includes all of the BLAS (Basic Linear Algebra Subprograms) routines as well as many mathematical operations, including solvers such as LAPACK, FFT, and more. These packages are built to take advantage of the SIMD execution units. Many other commercial libraries do as well. If you use other third-party software, ask whether the company supports the wider SIMD instructions and how much gain it gets from using them. Performance gains vary based on workloads and data sets, but the company should have some data showing what is achievable for a particular data set.
You should also check whether you are using the best library interface to deliver performance. In at least one case, a software vendor discovered that there were different interfaces to a library it was using that provided far better performance. The vendor was making hundreds of thousands of calls into the library. It modified its code to use the API that passed in blocks of work to do and reduce the number of calls. The performance gains were significant and well worth the changes. So check that you are using the best interface to third-party libraries.
Think SIMD
As you write code, always consider what can be done simultaneously. While compilers do a great job of recognizing opportunities for parallelism, the developer still needs to step in and help. When you can think of how operations can be done in a SIMD fashion, then it becomes easier for you to express it so that the compiler will generate SIMD code. So when you think about the computation of your code think, “How could more of this be done simultaneously?”
Taking the time to write ideas on a whiteboard can help. Don’t instantly change your code—the compiler might already be vectorizing several parts of it now. Think about what operations are repeated across different sets of data and keep them in mind as you work on software performance. Compilers and tools give you great tips, but they only go so far. The expert knowledge the developer has about the operations can be critical for the big breakthroughs. Consider what can be done to express the code to expose SIMD or vector operations.
Unfortunately, proper expression for the compiler is part skill, part art. The compilers weigh multiple possible code generation alternatives and have better knowledge of instruction latency and throughput than most developers. If the average developer tries to do too much and breaks things down excessively, it may obscure or prevent the compiler from producing the best possible code. Other times the developer needs to break things down so it is easier for the compiler. Although there is no perfect delineation on what the developer should do and what the compiler should do, there are specific things the developer can do. Future articles will provide more guidelines.
Performance Analysis
Performance analysis has several steps. One of the first steps is to determine where the compute time is consumed and whether that section consuming is threaded and vectorized well. This article covers only vectorization. Before spending time to modify code, make sure that the areas modified will impact performance.
Several popular performance analysis tools include Intel® VTune™ Amplifier XE, TAU Performance System*, Gprof*, and ThreadSpotter*. Each of these reveals important information about which sections of code consume the most computing resources and time. It is just as important to understand what the compiler is doing. A computationally expensive section of code may already be vectorized—it may just be expensive—so you need to know where time is spent and whether it is justified.
The compiler optimization reports provide a great deal of important and helpful information about optimizations applied. If you are starting on new code, it may be a good place to start. The compiler optimization reports for the Intel compiler are invoked with the -qopt-report compiler option (I usually use -qopt-report=3; see compiler documentation to understand the different report levels). As a developer, you recognize the need to understand performance and compiler decisions and know how to act on this information. When working on software performance of existing code, it is often better to begin with analysis tools rather than sort through the thousands of lines of compiler optimization reports that may be generated. You can take performance analysis data and then match or correlate the hotspots to the compiler optimization reports and begin performance tuning.
This article first displays performance analysis using Intel® VTune™ Amplifier XE and focuses on using hardware events. The value of hardware events you can collect varies based on processors. Historically, each Intel® processor had a different set of hardware event counters. Intel processor hardware events are moving toward fewer variations.
This example uses matrix multiply code (gitHub)
Alternatively, the Intel VTune Amplifier EX sample code shows similar results for three of the seven cases. On Windows* the default installation location of the Intel VTune Amplifier XE code is in: c:/Program Files(x86)/IntelSWTools/VtuneAmplifierXE/samples/en/C++/matrix_vtune_amp_xe as a compressed zip file. The same document is available on Linux* installations. If you use the Intel VTune Amplifier XE sample code edit multiply.h so that MAXTHREADS is set to 1.
- In Windows, select the release build, and then modify the project properties. Under C/C++/ All Options set Optimization Diagnostic Level to Level 3 (
/Qopt-report:3). - On Linux* modify the makefile by adding
-qopt-report=3to the ICFLAGS definition line (to build enter makeicc).
The data collected here comes from a 6th generation Intel® Core™ processor (code-named Skylake). This is advantageous because Skylake generation cores have excellent floating-point hardware event counters. The counters on Skylake distinguish between packed and scalar operations as well as Intel SSE versus Intel AVX floating-point operations. The Intel® Xeon Phi™ coprocessor (code-named Knights Corner (KNC)) has floating-point counters, but they are not as meaningful. The floating-point counters on Intel Xeon Phi coprocessors are prone to overcounting the number of floating-point operations. This overcount does not mean the data is worthless. The counters may overcount, but they do not undercount. This means that low floating-point counts on KNC are a definitive indicator of poor vectorization or poor floating-point performance. On the other hand, high floating-point counts on KNC are indicators that the code is probably pretty good, but that is not definitive. There are other things occurring that may be inflating the reported floating-point operations. On the 4th generation Intel® Xeon® processor generation (code-named Haswell) no floating point events were included. Skylake has clean counters that are easier to interpret.
This sample code available from github* runs seven variations of matrix multiply. The performance of the software is analyzed using the preconfigured general exploration hardware event collection in Intel VTune Amplifier XE. The resulting data is shown in the Event Count tab of the Intel VTune Amplifier XE data collection area (see Figure 1). The columns were reordered by dragging and dropping to place the double-precision floating-point events adjacent to the cycles per instruction (CPI) rate.
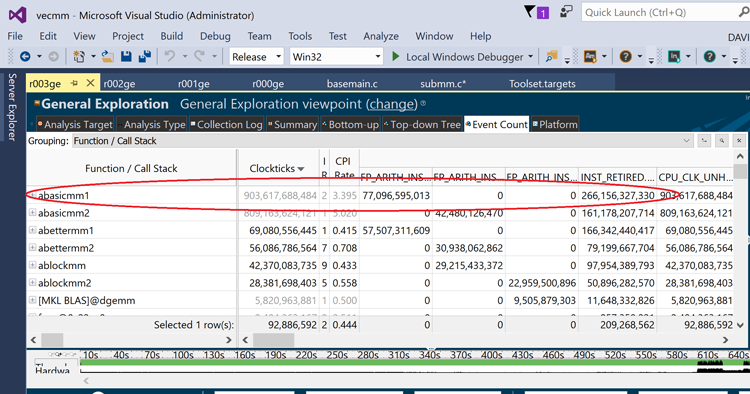
Figure 1: Event Count tab of the Intel® VTune™ Amplifier XE data collection
The clock ticks are largely in subroutine abasicmm1 (this correlates to multiply1 using the Intel VTune Amplifier XE sample code). Gains in performance will come from reducing the runtime of abasicmm1. Second, the FP_ARITH_INST_RETIRED.SCALAR_DOUBLE event has numerous counts, while the corresponding 128B_PACKED and the 256B_PACKED events are zero. This indicates that there is no vectorization achieved for this routine. Notice the high number for the CPI.
Each processor core has multiple execution units that can be active on each cycle. Ideally there would be at least three instructions issued and retired every clock cycle, and the CPI would be a low number. It is not realistic to expect to fill every available execution unit with productive work every cycle, but it is also unrealistic to accept a high clock per instruction ratio significantly greater than 1. Here, the data shows that abasicmm1 consumes the most time and is not vectorized, even though it does significant double-precision floating-point operations. Now let’s look at the optimization reports for subroutine abasicmm1.
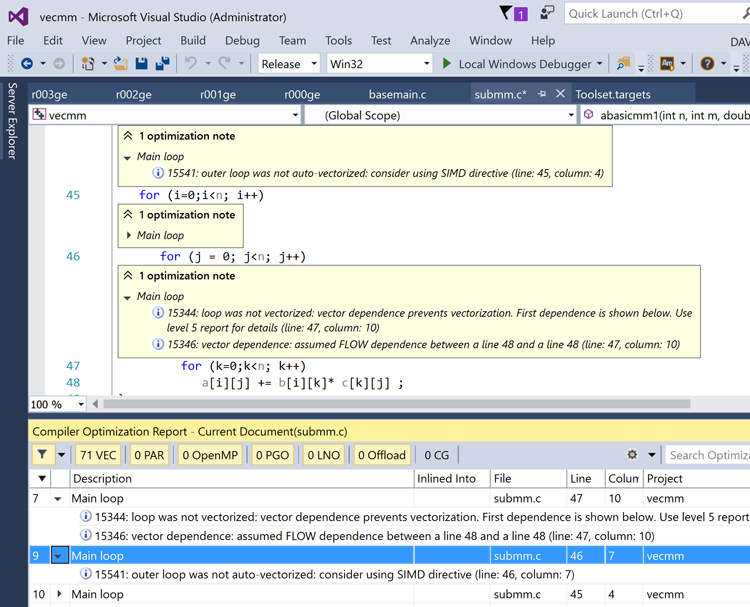
Figure 2: Compiler optimization reports within Visual Studio*.
Figure 2 shows a screen capture of the compiler optimization reports within Visual Studio*. On Linux, the submm.optrpt file has the same information (make sure you used -qopt-report=3). The compiler reports show that the loop is not vectorized and further explains that it did not vectorize the inner loop because it could not determine the independence of all variables being operated on. The report also suggests the developer consider adding a directive or pragma for the compiler to inform the compiler that there are no dependencies.
The process followed above was to use performance analysis data and compiler reports to determine vectorization. There is another method that does all of the above using one utility: Intel® Advisor XE.
Intel Advisor XE combines runtime performance data and the compiler optimization reports, correlates the data, and then sorts it. This combines hotspot analysis along with runtime information, which can include the number of loop iterations, number of subroutine calls, and memory access stride lengths in addition to the compiler report about its actions for the code such as inverting loops, vectorizing sections, and more. Some codes have specific regions or hotspots to focus on, and focusing developer effort in these areas yields significant performance improvements. Some codes have a flatter profile, and effort must be extended across many files to get large performance gains. Some changes can be embedded into common files or modules that are included so that the changes propagate too many files and their subroutines and functions, but the work is not trivial. Intel Advisor XE can help track progress as well as help determine where to begin the code modernization work. Figure 3 shows the survey results of applying Intel Advisor XE to the sample code.
Intel Advisor XE initially sorts data by self time (time actually spent in the routine, excluding calls to other routines from within it), and abasicmm1 is at the top. The information from the compiler report about assumed dependency as a reason preventing vectorization is listed as well as information showing that the loop was not vectorized. Additional helpful information can be collected such as the number of loop trip counts. Intel Advisor XE conveniently combines much of the information from compiler reports as well as runtime and performance analysis into one location.
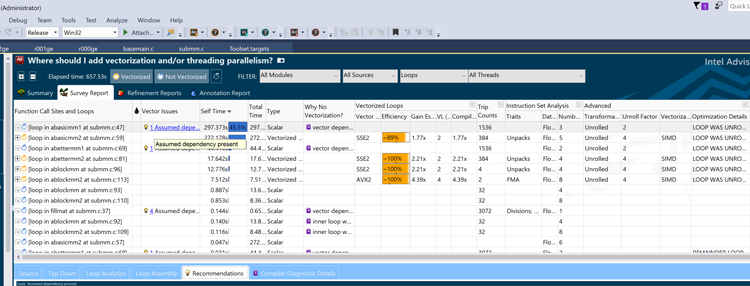
Figure 3: Results of matrix.icc in Intel® Advisor XE.
Intel Advisor XE shows that the loop was unrolled by two by the compiler so there are only 1536 loop counts instead of 3072 (the matrix size). Intel Advisor XE’s organization simplifies the tuning and vectorization process.
Vectorizing Routines Overview
You can add the OpenMP* pragma contruct (#pragma omp simd) above the innermost loop to let the compiler know it is safe to vectorize this loop. This is done in routine abasicmm2 and improves performance by 9.3 percent. Notice that the Intel VTune Amplifier XE report still shows a high CPI for routine abasicmm2 (see Figure 1). While it is vectorized, it is not an efficient vectorization. Routines abettermm1 and abettermm2 swap the order of the second and third nested loops. This changes the operations from dot product orientation to a daxpy orientation (eliminates a reduction). The performance for routine abettermm1 is better than a 10x improvement over abasicmm1.
Both Intel Advisor XE and Intel VTune Amplifier XE report that abettermm1 is not vectorized. Notice that the Intel VTune Amplifier XE report shows all the floating-point operations as scalar operations. The routine abettermm1 does not use the OpenMP simd pragma. The routine abettermm2 adds a #pragma omp simd to the code and vectorizes the output. Advisor XE shows abettermm2 is vectorized using Intel® AVX operations, and Intel VTune Amplifier XE shows the use of packed 128-bit floating-point operations. This improves performance as well as vectorization (the routine abbettermm2 is similar to routine multiply2 in the Intel VTune Amplifier XE sample code).
This article previously mentioned that a high CPI indicates inefficiency. The article acknowledges that like floating-point counters on KNC, CPI is an indicator providing a hint, not a definitive notification that something is bad. The order of magnitude is still important. Notice that the CPI for abasicmm1 and abasicmm2 is greater than three for both routines. This is very high and in this case it is indicative of poor performance; routine abettermm1 shows a CPI of 0.415 while routine abettermm2 shows a CPI of 0.708. Routine abettermm2 provides better performance and is vectorized, while abettermm1 is not vectorized. It is better to use fewer instructions that to do more work (packed SIMD operations) per instruction than it is to use more instructions that retire a few more instructions faster but overall completes less work per cycle (but provides a lower CPI). Using CPI as a metric does not capture this principal and thus many criticize its use as a performance metric. The example case between abettermm1 and abettermm2 illustrates this limitation. Note: CPI should never be between three and four for performance-critical routines.
Once you are aware of this limitation, CPI can be used to indicate places to explore for optimizations. Table 2 lists the performance of the different matrix multiply examples.
| Routine | Execution time (secs) |
| abasicmm1 | 276.9 |
| abasicmm2 | 253.2 |
| abettermm1 | 25.9 |
| abettermm2 | 21.4 |
| ablockmm1 | 14.9 |
| ablockmm2 | 10.0 |
| MKL cblas_dgemm | 2.0 |
Table 2: Matrix routine performance.
The routine abettermm1 is more than 10 times faster than the original abasicmm1 routine. It is well known that blocking algorithms improve performance for matrix multiply (see http://ocw.mit.edu/courses/mathematics/18-06-linear-algebra-spring-2010/video-lectures/lecture-3-multiplication-and-inverse-matrices/ and http://networks.cs.ucdavis.edu/~amitabha/optimizingMatrixMultiplication.pdf).
When blocking is added to the nested loops in ablockmm1, performance improves even more, reducing to 14.9 seconds. Intel Advisor XE reports that the code, ablockmm1, is now vectorized as well as the instruction set used (Intel SSE2) in Figure 3. This is certainly good news, but this is a Skylake processor and Intel AVX 256B_PACKED SIMD operations are available and the 256B_PACKED counter is still 0. This is shown in Intel VTune Amplifier XE as well as in Intel Advisor XE.
The code is still using vector operations one half the width of the registers available on this platform. The next step is to instruct the compiler to generate Intel AVX2 code. This can be done using the compiler option /QxCORE-AVX2. Because we wanted to show the difference between instruction sets, instead of using the compiler option for the full file, a pragma was used to apply the compiler option to only the ablockmm2 routine.
This pragma is: #pragma intel optimization_parameter target_arch=CORE-AVX2. Looking at the Intel VTune Amplifier XE data showing clock ticks or looking at the measured time, doubling the width of the SIMD operations did not reduce execution time in half. There are still many other operations going on: controlling the loop, loading and stores, as well as data movement. Do not always expect performance improvement to match the ratio between the SIMD register width.
The Intel VTune Amplifier XE results now show 256B_PACKED_DOUBLE being executed for routine ablockmm2. It’s worthwhile noting that the preconfigured analysis time general exploration was used to collect this data. The general exploration is excellent for qualitative comparison. General exploration uses multiplexing to sample a wide range of hardware events. As a result, the numbers are not valid quantitative results. Data collection for this article showed a wide variation in floating-point operations retired using general exploration. If you need to get an idea of the amount of floating-point work being done or a ratio of floating-point work, you can create a custom analysis type in Intel VTune Amplifier XE and explicitly collect the desired events using Intel VTune Amplifier XE customer analysis or a package like TAU which builds on top of PAPI* (an open source processor event counter). A custom analysis project in Intel VTune Amplifier XE collecting counts for FP_ARITH_INST_RETIRED.128B_PACKED_DOUBLE does not multiplex and produce consistent results from run to run. You can collect these events and divide by clock ticks to obtain a flops rate, which is the best metric to measure vectorization efficiency.
Vectorizing Results with the Intel® Xeon Phi™ Coprocessor
Great performance gains await those willing to improve the vectorization of their code. KNC is particularly sensitive to good vectorization. This has motivated many to improve the vectorization and optimization for KNC. The developers typically saw that the same software changes provided performance gains on the more common Intel® Xeon® processor platforms. Regardless of the platform you target, performance will improve with better vectorization. The KNC generation is unique in the simplicity of its cores with the wide SIMD registers. It is designed with four-way symmetric threading, and its performance shines when three to four of the SMTs are utilized by code that also uses the 512-bit-wide SIMD operations. The sample code tested in this example is sequential, that is, not threaded. The KNC cores did not include the many advances in prefetch technology in other lines of Intel® Xeon® family of processors, and the compiler makes extensive use of explicit prefetch instructions to deliver good performance. The prefetch instructions generated by the compiler for KNC greatly impact performance. When this test code was run, abettermm2 provided the best performance over the block matrix multiplies. This is probably the result of better prefetch.
Unexpectedly, abasicmm2 (SIMD dot product oriented matrix multiply) performed an order of magnitude worse than abasicmm1 (scalar dot product oriented matrix multiply). This is currently unexplained. As the compiler reported this loop as vectorized, it reinforces the admonition to not rely purely on compiler reports, but to combine performance data and compiler reports together. The timings are shown in the clock ticks column of Figure 5. The KNC data was collected with both TAU Performance System and Intel VTune Amplifier XE. The TAU data is displayed graphically using ParaProf (see Figure 4).
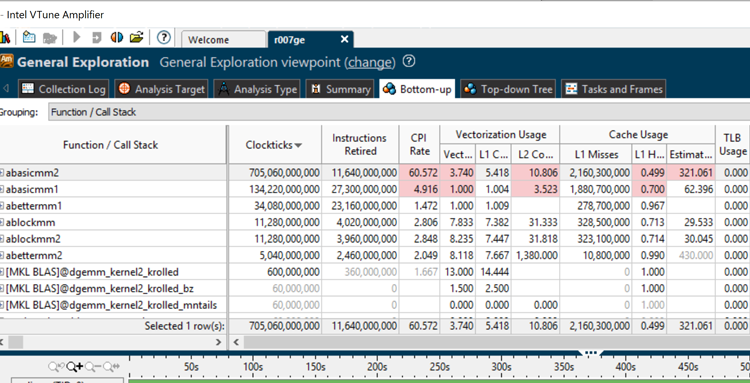
Figure 4: ParaProf displays of vector intensity and time (hotspots).
ParaProf allows the user to define a derived metric based on the events collected by TAU. I created the derived metric VPU_ACTIVE_ELEMENTS/VPU_INSTRUCTIONS_EXECUTED as recommended in the KNC tuning guide and ParaProf created the associated bar chart (tuning guide – see https://software.intel.com/content/www/us/en/develop/articles/optimization-and-performance-tuning-for-intel-xeon-phi-coprocessors-part-2-understanding.html). Clock time for the routines is in the ParaProf display on the top window of Figure 4, vector intensity is in the lower window.
As expected, abasicmm1 and abettermm1 have low vector intensity ratios of about 1.0. Routine abasicmm2 shows a mediocre ratio, 3.7, yet this had the worst performance time indicating that this is one of the times there was an overcount of Vector Processing Unit (VPU) operations. Routines abettermm2 as well as both block matrix multiples ablockmm1 and ablockmm2 report a ratio of eight missing performance differences between the three routines. Remember this is for double precision; for single-precision floats you would expect something close to 16. The ratios in the range of one to three of VPU active/VPU instructions retired correspond to poor performance. The Intel VTune Amplifier XE data for KNC are also shown in Figure 5.
To collect data for vector intensity (the ratio of VPU active/VPU instructions) use a command line that includes the options:
-collect general-exploration -knob enable-vpu-metrics=true
The full command used for this collection was
amplxe-cl -collect general-exploration -knob enable-vpu-metrics=true -target-system=mic-native:mic0 -- /home/drm/runscript
where runscript set the environment and invoked the binary. The first column in the Vectorization Usage region is vector intensity (VPU active/VPU executed).
Figure 5: Intel® VTune™ Amplifier XE general exploration viewpoint.
Intel VTune Amplifier XE automatically captured the call to dgemm in the Intel MKL, the TAU Performance Systems instrumentation was not configured to capture metrics for Intel MKL. The Intel VTune Amplifier XE screen capture here is after using the Intel VTune Amplifier XE filter capabilities to filter out rows showing events collected for the OS and other services running on the system. Notice the same low vector intensity for abasicmm1 and abettermm1 (see Figure 5).
The high vector intensity for the call to dgemm in Intel MKL (over eight) shows the impact of counting all vector instructions, not just the floating-point operations. Notice that the CPI for all the routines on KNC is greater than one (see Figure 5).
It is important to remember that unlike other Intel® processors and future Intel® Xeon Phi™ processors, the KNC generation lacks out-of-order execution. These lead to a higher CPI (greater than one). Regardless a CPI of 4.9 or even 60 are reasons to explore. The KNC relies on symmetric multi-processing where multiple threads share execution units, and when one thread stalls another will utilize the execution unit. These samples are single threaded to show the focus purely on vectorization/SIMD.
Summary
Vectorization is important for performance; top performance was obtained only with vectorization. The compiler reports that the code was vectorized is only one indicator; the compiler always vectorized routine abasicmm2, but this routine did not deliver good performance. CPI greater than 1.0 is an indicator of possible low efficiency. CPI on the order of three to four is low efficiency. An examination of the efficiency by considering the ratio of packed SIMD instructions provided a much better calibration of how well code vectorizes. The Skylake generation and newer processors provide the best platforms for evaluating floating-point vectorization. These platforms allow an exact calculation of floating-point operations per cycle (or second) and allow a precise calculation of efficiency. Other metrics are helpful and when combined allow a developer to consider whether the vectorization is efficient.