- Performance Improvement Opportunities with NUMA Hardware
- NUMA Hardware Target Audience
- Modern Memory Subsystem Benefits for Database Codes, Linear Algebra Codes, Big Data, and Enterprise Storage
- Memory Performance in a Nutshell
- Data Persistence in a Nutshell
- Hardware and Software Approach for Using NUMA Systems
Tip: This approach may require reworking earlier decisions when hardware changes or measurements reveal your application is not working as desired. So write code that easily facilitates reworking data structures and algorithms when measurement reveals an unexpected problem.
To build an application that runs effectively on non-uniform memory access (NUMA) hardware:
- Choose the algorithm.
Choose the algorithm with the fewest operations and the most suitable peak memory size requirement. Consider the following:
- Is it easy to parallelize the algorithm?
- Is the data needed for memory subsystem operations as near as possible to the cores that will perform those operations?
- Choose the parallel hardware.
After you know the approximate number of operations and the memory requirements, estimate:
- The number of cores required to perform the operations in a reasonable time
- The amount of memory required to store the data structures
If the data structures are too large to fit on one system, plan on using a cluster with threads on each cluster node.
If most of the operations are in loops that can be vectorized, consider using an Intel® Xeon Phi™ processor as the compute node. Write small kernels of code that capture these loops in an easily tested environment, and verify the compiler vectorizes the loops.
If most of the operations cannot be vectorized, consider using an Intel® Xeon® processor.
- Plan the data movement.
After you tentatively decide upon the number of cores, assign the operations to threads, giving each thread about equal work while minimizing the implied data movement. Try to:
- Fit moved data into caches and reuse it from the caches, instead of fetching it again later.
- Move the data before it is needed.
- Maximize the use of moved data.
Data moves in 64-byte chunks called cache lines. If you must move data, use as many of the 64 bytes as possible.
- Measure the real, running application to verify it is doing what you intended.
Small programming mistakes can cause a huge deviation from intended behavior. For example an assert(x < 0); can destroy vectorization. A slight miscalculation in how many array elements can fit into a cache can change a 99.9% L2 cache hit rate into a 1% L2 cache hit rate. Err of the side of caution – don’t try to fill the caches.
Choose the Algorithm
This is the subject of many books and university courses.
Be aware: The best serial algorithm and the best parallel algorithm may be very different. If you have many instances of a problem to solve, it may be best to:
- Use the serial algorithm on each instance.
- Use the parallel algorithm to perform many instances simultaneously.
Such problems are referred to as embarrassingly parallel, and are only worth doing together if some amount of the work can be shared.
Resource: Structured Parallel Programming –a compilation of high-performance parallel programming examples.
Choose the Parallel Hardware
Estimating the execution time of a short piece of code can be difficult, especially for someone not familiar with how a particular machine executes. In actuality, the only way to discover execution time is to execute code on real data, or at least on data as large as the real data. However, here are some useful approximations.
Estimate the Number of Cores
In simplified terms, an operation involves reading an integer or a floating-point number, doing some arithmetic operation on the data, writing the result, and choosing what to do next.
- The time it takes to read the data depends on how far the data must travel, how early the data is requested, and if the core can do something else while it is waiting for the data. If the data is reused within a few hundred operations, assume the second use is free. If the data is reused later, assume the second use is equivalent to doing 100 integer operations.
- Assume floating-point operations take about 5x longer than integer operations.
- Assume that a few writes are free, but that thousands of close-together writes cost about 100 integer operations each.
- Assume that choosing to do the same subsequent instruction repeatedly is free, but that choosing a different subsequent instruction is about the same as 100 integer operations.
Thought of this way, a core can do about a billion integer operations per second. Although this number is crude, it should help you estimate the number of cores you need. The only way to estimate with more accuracy is to measure similar code.
Estimate the Needed Memory Capacity
Many modern developers don’t know the number of bytes required to hold various scalar types – char:1, bool & int:4, long:4 or 8, int64:8, float:4, double:8, pointer:4 or 8. When there are thousands or millions of such data, limited cache capacity becomes important. The 32-KB L1 cache, 256-KB L2 cache, and the few-MB L3 cache can hold more items if you change from a double to a float, resulting in a huge performance gain.
For this reason, it is a good idea to add code to your application that can report the total amount of memory in use.
Estimate the Amount of Memory Traffic
This is even harder to estimate than the number of operations or the size of data.
Sometimes, though, it is very easy:
- Ignore all traffic to scalar variables and look only at traffic to complicated data structures. The scalar variables are in core registers or the L1 or L2 caches, so they do not dominate memory traffic.
- Look only at big data structures. If a data structure takes up 1 GB and the algorithm reads all of it three times, that is about 3GB (3 x 1GB) of traffic.
Articles, such as List of device bit rates, provide bandwidth numbers. A typical 2016 processor with dynamic random-access memory (DRAM) dual inline-memory modules (DIMMs) can transfer about 10 GB per second per DIMM. The bandwidth must be shared by all the cores requesting data. An Intel Xeon Phi processor with an attached Multi-Channel DRAM (MCDRAM) or High-Bandwidth Memory (HBM) can transfer about 400 GB per second, spread across the cores. You need more processors if you need to transfer more, because each processor can run its DIMMs separately.
However, you do not know where you need this bandwidth, and hence the number of DIMMs, until you plan the data movement.
Plan the Data Movement
The instructions that read and write the data are executed on whichever core the thread is using. The memory subsystem moves the data from the core where it is written to the cores that need it.
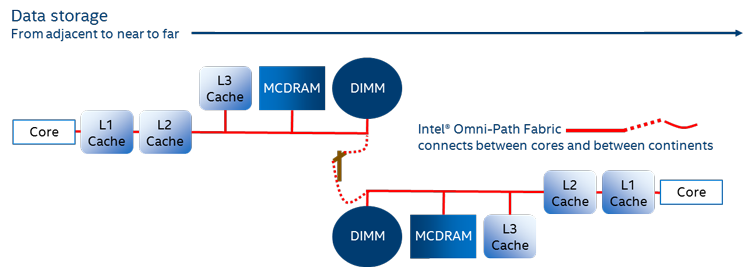
While details differ among processors and systems, the data movement between cores is similar to this:
- The data is read into or written from a register in a core. This movement occurs between the core and its private L1 cache.
- L1 cache (very near the core) – The threads running on the core share this cache, which can hold about 32 KB of data. Instructions can obtain data from this cache almost as fast as the cores can execute instructions. L1 caches can deliver 1000s of GB per second to their core. They exchange data with an adjacent L2 cache.
- L2 cache (private to one core or shared by two adjacent cores) – Each L2 cache can hold about 256 KB of data, but data takes about twice as long to get to the adjacent core as from the L1 cache. Usually the data gets placed in the L1 cache as part of this movement. The L2 caches interact with the rest of the memory subsystem via a set of interconnected buses. These buses connect to the many L2 caches and also to the partitioned L3 cache (if L3 exists), the memory controllers managing the memory devices, and the I/O controllers managing the I/O devices.
- L3 cache (shared by the cores on Intel Xeon processors, non-existent on current Intel Xeon Phi processors at time of writing) – Access times depend on how far the data is cached from the core, because the access must hop between the connection points on the bus. This access can even go across processors on the motherboard, which takes even longer. The resulting access times can be 10x longer or more than the L2 access times. Achievable bandwidth varies dramatically depending on distance and congestion. Each core can expect to exchange at most a few tens of GB per second with the L3 caches. If the data is not in an L3 cache, then it is accessed by a memory controller.
- The memory controllers manage the major kinds of memory devices. The three most common are:
- On-processor memory - MCDRAM and HBM (shared by all the cores, only available on Intel Xeon Phi processors at time of writing). This is DRAM memory physically placed atop the processor package, with many wires into it. Because of the many wires, lots of the memory can be accessed simultaneously, but because it is DRAM, individual accesses take about the same time as an off-processor DRAM DIMM access takes. The simultaneous access is needed to feed the many vector processing units within an Intel Xeon Phi processor.
- DIMMs and similar devices – Hundreds of instructions may execute while waiting for data fetched from these devices.
- Distant devices accessed through Intel® Omni-Path Fabric (Intel® OP Fabric). The latencies and bandwidth to access this memory vary from nanoseconds to minutes depending on the hardware. In the future, it may be possible to access memory in a space craft millions of miles from the core – and that access will take a while.
You can increase the achieved data flow by thousands of GB per second per core by making most memory accesses hit in the issuing cores L2 cache. Repeatedly missing the L2 cache reduces the flow to tens of GB per second per core.
Design your algorithms to minimize misses of the L2 cache by using careful data placement and execution (cache-aware programming), or by using techniques that do this implicitly over a wide range of cache sizes (cache-oblivious programming).
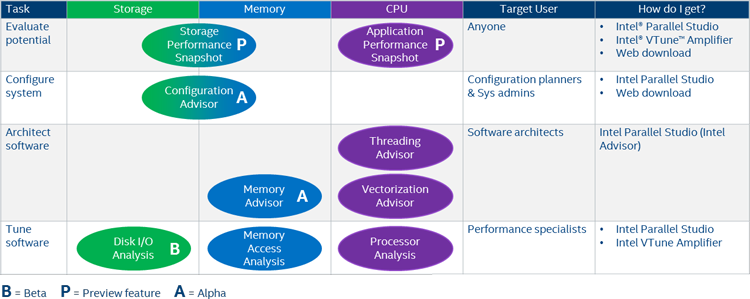
Resource: Intel® VTune™ Amplifier – Intel® VTune™ Amplifier memory traffic measurement capabilities can show you how much data is currently moving through the memory subsystem.
Design Cache-Aware and Cache-Oblivious Algorithms
Cache-aware and cache-oblivious algorithm design techniques maximize cache hit rates.
Cache-oblivious algorithms work well with a wide range of cache sizes and are often easy to write. Investigate this technique first.
Cache-aware algorithms explicitly discover the cache size and tune themselves accordingly; however, determining correct tile sizes is difficult and differs across systems.
Explicitly Control Data Movement
Thread affinity is used to bind threads to cores, also known as NUMA nodes. Operating systems can bind virtual memory to physical memory near a core. You need to bind the relevant threads to cores, and the data each consumes must be near that core.
Various APIs and defined behaviors choose if a page of virtual memory is bound to the physical memory near a particular core. On many systems, by default, the core that first touches the page is the core closest to the page. A page close to a core may be able to respond faster, and with less impact on other memory traffic from other nodes. This presents a performance problem where the data structure is allocated and filled by a thread on one core before it is used by other threads spread across all the cores.
Microsoft Windows* OS resources:
Linux* OS resources:
- NUMA policy library
- Overview of Non-Uniform Memory Architecture
- Control NUMA policy for processes or shared memory (get_mempolicy, migrate_pages, move_pages, set_mempolicy, mmap, mbind, madvise)
More Esoteric Techniques
Processors use two other techniques to cope with the time it takes to read data:
- Processors look at the sequence of memory accesses, predict what will be needed in the future, and start fetching the data before it is requested. This is called prefetching.
- Processors reorder the executed instructions to usefully fill the gap between when data is fetched and when data is needed. This out-of-order execution can reorder hundreds of instructions, but changes only performance, not results.
Developers and compilers can use special instructions to explicitly prefetch data, or to cause data to bypass some of the caches so that the moved data doesn’t evict data in those caches. The keywords for these concepts are prefetching and non-temporal loads and stores.
Resource: Memory Management for Optimal Performance on Intel® Xeon Phi™ Coprocessor: Alignment and Prefetching
Maximize the Use of Moved Data
Reducing the distance data must be moved, by getting data into caches near the cores that need it, is the most important optimization.
Because data is moved between caches in 64-byte quantities – and is stored that way also – use most of the 64 bytes by:
- Using the fewest number of bytes to store the data
- Making sure all the moved bytes are used
Consider, for example, the following array.
struct Element { int key; double data; } array[100];
for (int x = 0; array[x].key != target; x++) {}
The C++ compiler allocates these into adjacent bytes in memory like this:

To search the array looking for a particular key, the hardware moves the bytes for the ints, the unused, and the doubles into cache. Code this like so:
class Array {
    private: int keys[100]; double datum[100];
    int&    key (int i) { return keys [i]; }
    double& data(int i) { return datum[i]; }
} array;
for (int x = 0; array.key(x) != target; x++) {}
Now the bytes moved while the code searches for the target key do not hold anything except the possible matches that must be examined. This may run 4x faster than the original code!
If float is precise enough to represent the information, then twice as much data could be held in the caches, causing a potentially large decrease in cache misses. Do not make the mistake of thinking this merely halves the cache miss rate. If all the data elements are accessed in the following loop, the change may mean all the data is in the cache for the second and subsequent iterations, instead of all the data missing the cache. This could result in a 10x or more speedup.
for (int iteration = 0; iteration < N; iteration++) {
	for (int x = 0; array.key(x) != target; x++) {
			use array.data(x)
	}
}
Measure the Real, Running Application to Verify It Is Doing What You Intended
Measuring on real hardware with full-sized workloads is critical. It is amazing how often such measurements show unexpected problems.
Resource: Intel® VTune™ Amplifier – Intel® VTune™ Amplifier can show you:
- How much data is currently moving through the memory subsystem
- If your program stalls while waiting for memory traffic
Cache Hit Rates
The differences between a laptop (few cores, few memory channels), an Intel Xeon server (more cores, more memory channels), and an Intel Xeon Phi processor (many cores, different memory subsystem) make it difficult to predict the hotspots on each.
The L1 and L2 cache miss rates on the various systems give a strong indication of tiling success, but be aware that the numbers of hyperthreads per core differ and the number of cores sharing the L2 cache can differ. You cannot compare the L2 cache hit rates if one system has a dedicated L2 cache for two hyperthreads on a core, and another has two cores with four hyperthreads sharing an L2 cache.
Vector Processing Rates
The number and capabilities of the vector processing units vary dramatically between systems, and their usage depends on the exact code generation options specified to the compiler.
Memory traffic may be the constraint on one system, whereas insufficient vector processing units to keep up with the data flowing from the L1 and L2 caches may be the constraint on another system. This is especially likely after you tile algorithms to keep almost all accesses in the L1 and L2 caches.
Summary
The previous article, Data Persistence in a Nutshell, explained how to eliminate file system overhead by using non-volatile memory. This article is the last in this introductory series. It emphasizes the importance of identifying and eliminating specific bottlenecks your application may encounter. As you measure and improve your applications, we recommend you dig deeper into the concepts this series introduced, and either become or employ an expert in the techniques. Remember the advice to all woodworkers: Measure twice, cut once. Everyone in this arena has experienced the surprise of increased execution times, and the pleasure of simple changes that reduce execution times by factors of 10 or even 1000 when an obscure bottleneck is eliminated. May that pleasure also be yours.
About the Author
Bevin Brett is a Principal Engineer at Intel Corporation, working on tools to help programmers and system users improve application performance. He hopes you enjoyed learning about the importance of the memory subsystem when it comes to application performance. The cores are more numerous and the memories are larger, but bridging the gap between them has never been more important.