Co-author Paul Veitch
Download PDF [890.59 KB]
1. Introduction
Future 5G networks must support a very diverse range of services and applications, some of which will have extremely stringent targets of end-to-end latency, heading toward sub-millisecond, to ensure that key performance indicators (KPIs) for quality metrics are satisfied.1 In addition to applications already well known to be sensitive to latency (such as voice), examples of low-latency business applications on 5G include those in the healthcare sector (for example, remote surgery), the automotive sector (such as intelligent transport systems) and manufacturing (for example, industrial process automation).2
As set out in the ITU-T Technology Watch white paper detailing characteristics and requirements of The Tactile Internet, the main driver for sub-millisecond latency targets relates to human reaction and response times, and how the combination of auditory and visual components contribute to the overall user experience.3
As highlighted in Figure 1, which shows an example of a sensor/actuator interaction via radio access infrastructure and edge compute infrastructure, the actual aggregated end-to-end latency will be dictated by the system components that make up the architecture. A key challenge is to understand how individual elements contribute to this latency budget.
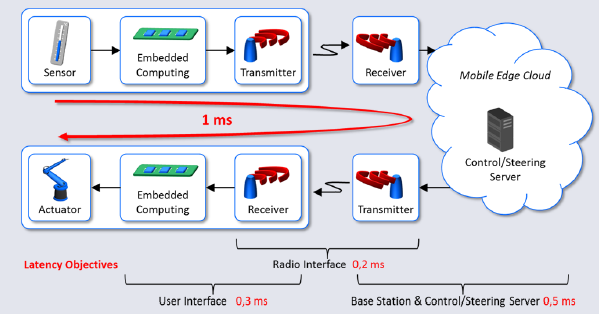
Figure 1: Example of end-to-end latency targets (original diagram adapted from reference3).
One of the key pillars of 5G architecture and design involves leveraging network functions virtualization (NFV) and software defined networks (SDN) to maximize flexibility and reduce overall capital and operating costs.4 NFV infrastructure (NFVI) can potentially be deployed in a number of locations to satisfy specific functional requirements, ranging from the edge of the network, including certain edge components of the radio access network (RAN), through to the core network (CN), comprising various gateway functions in both control plane and data plane domains.5
The focus of this paper is how to characterize the NFVI contribution to latency within the end-to-end architecture, and how specific optimization toolsets and fine tuning can be applied to NFVI to help achieve deterministic performance. Moreover, the testbed used to conduct experiments comprises solely open source components (hardware, hypervisor, virtual infrastructure manager, and so on), and aligns with the OPNFV (Open Platform for NFV) best practice for tuning Linux*-based KVM hypervisors.6
As well as being built purely from open source hardware and software system components, thus maximizing flexibility and reducing cost, a novel testing framework was designed for the experiments which enabled a unique blend of performance characterization to be performed, as follows:
- Since virtual network functions (VNFs) contribute to the latency profile, and this will be dependent on the type of VNF in question, it is crucial to ascertain a baseline contribution from the NFV infrastructure: a simple but effective approach involving a skeleton application forwarding packets between virtual network interfaces is adopted.
- Latency itself can be measured with different criteria, the most obvious data points being minimum, average, and maximum. Although average values are essential, it is equally important to determine maximum values, as these provide a worst-case view of latency and how it may impact on overall performance: we describe how longer duration soak testing can be used to analyze spikes in latency, and this ties together with the use of the skeleton application to determine a baseline for both average and maximum latency.
- Analysis of packet sequencing, and particularly the detection of occurrences of out-of-sequence (OOS) frames, is often overlooked during performance testing: we describe how OOS was incorporated into the performance characterization test regime.
Section 2 explains in detail the testing environment and the objectives of the experiments carried out. Section 3 presents the key test results, while Section 4 draws conclusions and suggests areas for further research and development.
2. Open Source Testbed
2.1 Overview
The testbed comprises a number of distinct elements, with the NFV-specific components based predominantly on open-source ingredients. A high-level overview of the generic setup is shown in Figure 2.
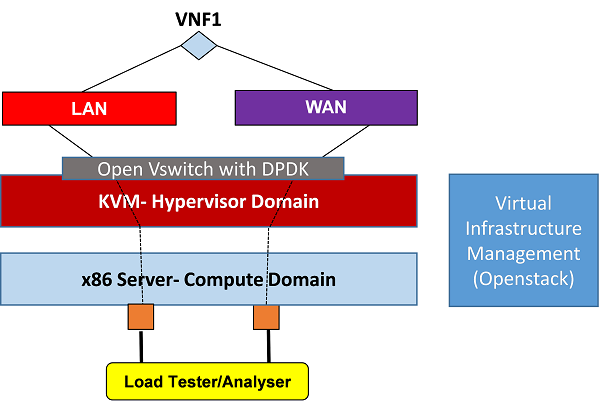
Figure 2: Open source NFV infrastructure setup.
Three specific configurations were assessed, with one of these being a simple vanilla un-optimized configuration (to provide a comparative reference), while the other two configurations are variations of high-performance platforms, specifically tuned and set up with the intent of minimizing latency. As shown in Table 1, the high-performance (optimized) platforms use the same hardware, but with different system components and versions in the hypervisor and VIM domains.
|
|
Un-Optimized |
Optimized-1 |
Optimized-2 |
|---|---|---|---|
| Hardware-Compute Domain |
HP BL460 G8 Proliant* Blade |
Intel® FS2600 server boards |
Intel FS2600 server boards |
| Hypervisor Domain-Base OS |
Fedora* 21 |
Fedora 21 |
Fedora 22 |
| Hypervisor Domain-Linux* Kernel |
3.18.8-201.fc21.x86_64 |
Real-Time*: 3.14.36-rt34 |
Real-Time: 3.18.24-rt22 |
| Hypervisor Domain-OVS |
2.4.0 |
2.3.2 |
2.4.9 |
| Hypervisor Domain-DPDK |
N/A |
2.0.0 |
2.1.0 |
| VIM Domain-Openstack release |
Kilo* |
Kilo |
Liberty* |
Table 1: Testbed setup variants.
2.2 Optimized Versus Un-Optimized
As well as the fact that different hardware is used, the main differences between the optimized setups and the vanilla, un-optimized setup is the use of a Real-Time* kernel within the base OS, and the use of Open Vswitch* (OVS) with Data Plane Development Kit (DPDK). The use of a real-time kernel promotes reduced latency due to prioritization and pre-emption, whereby there is more predictability of the time taken between a request for a task to be performed and the actual task being executed by the CPU.7 The use of DPDK, meanwhile, accelerates packet processing (thereby minimizing latency) through the OVS. In the standard OVS, packets that are forwarded between network interface controllers (NICs) do so in the kernel space data path of the virtual switch that consists of a simple flow table indicating what to do with packets that are received. In the OVS with DPDK model, the main forwarding plane (sometimes called the fast path) is in the user space of the OVS and uses DPDK. One of the key differences with this architecture (Figure 3) is the fact that the NICs are now poll mode drivers (PMDs), meaning incoming packets are continuously polled, rather than being interrupt-driven in an asynchronous fashion.
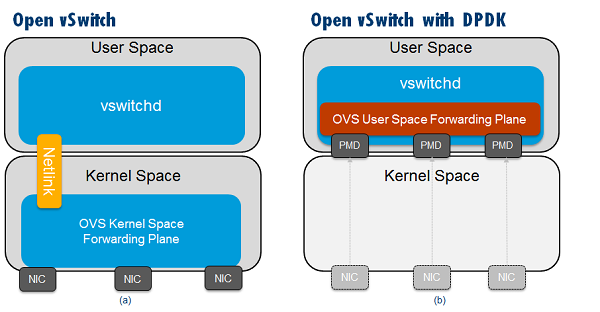
Figure 3: Overview of: (a) Open vSwitch, (b) DPDK vSwitch.
A further distinction between optimized and un-optimized setups is that the optimized setups also enforce additional platform and operating system tuning, including the following:
- Disablement of power management settings, which can reduce power consumption at the expense of latency: includes processor P-state and C-state.
- CPU isolation, allowing dedicated CPUs for the VNFs and virtual switch, and isolating those CPUs from the kernel scheduler.
- Memory allocation and reservation, including the use of HugePages.
- Non-uniform memory allocation (NUMA) setup to allow CPU/memory to be allocated in the same NUMA node, and ensuring that this is the same socket that connects directly to the physical NIC interfaces of the x86 compute host.
2.3 Optimized-I and Optimized-II
There are two notable distinctions between the optimized-I and optimized-II setups. The first is that some further fine tuning to the real-time kernel setup is applied in the optimized-II case, as follows:
- The system time stamp counter (TSC) should be marked as reliable/perfect, and any associated watchdog timers should be disabled.
- The read-copy-update (RCU) is a kernel synchronization feature and setting this can reduce latency associated with hosting VNFs.
- Setting No Hertz Kernel reduces frequency tick effects and associated latency impacts due to host-related interrupts.
The second distinction between the optimized-I and optimized-II setups is that the optimized-II setup uses later variants of some of the key components within the hypervisor and VIM domains, as described in Table 1. Indeed, the ingredients of the optimized-II configuration are part of the Intel® Open Network Platform (Intel® ONP) 2.0 framework, which also aligns closely with the OPNFV Brahmaputra* architectural release.8
2.4 Additional Testbed Characteristics and Objectives
The two types of VNF used in the testing were a Brocade* 5600 virtual router, and a specially designed DPDK-based skeleton application VM set up to forward packets in a bridged (or pass-through) fashion between two virtual interfaces, connected to distinct virtual networks (depicted in Figure 2 as LAN and WAN). The purpose of the skeleton application VM was to introduce minimal VNF-specific latency and therefore provide a close representation of the infrastructure baseline contribution (in other words, compute + hypervisor domains) to the end-to-end latency.
A Spirent Test Center* C1 load testing appliance was used for running test traffic. The test equipment uses a signature with a timestamp to determine the latency between frames—this signature is at the end of the payload next to the frame check sequence (FCS), and has a timestamp, sequence numbers and stream ID. The same traffic load comprising a single traffic flow was generated to the system under test in each direction, and the results described in the following section capture the worst-case metrics observed for a particular direction (that is, the cited values of latency are for a single direction only and not round-trip values).
The principal objectives of the testing were as follows:
- To confirm relative latency measurements for un-optimized versus optimized setups.
- To explore the relationship between duration of tests and the occurrence of latency spikes, thus affecting the worst-case maximum latency figure.
- To present a baseline view of the infrastructure contribution toward end-to-end latency.
- To assess performance improvements possible with more recent system components (for example, optimized-II in place of optimized-I): in terms of latency and OOS frames.
The following section describes the test results.
3. Test Results
3.1 Virtual Router Five-Minute Tests
The average one-way latency measured over five-minute durations for four different packet profile scenarios is shown for the single VNF setup in Figure 4 and the dual VNF setup in Figure 5. In these tests, the VNF used was the virtual router.
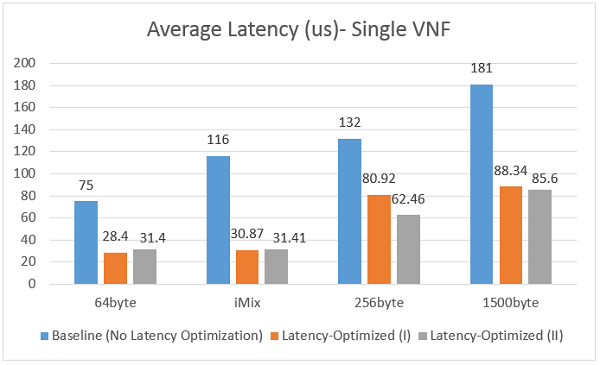
Figure 4: Five-minute average latency results in microseconds for single VNF (lower is better).
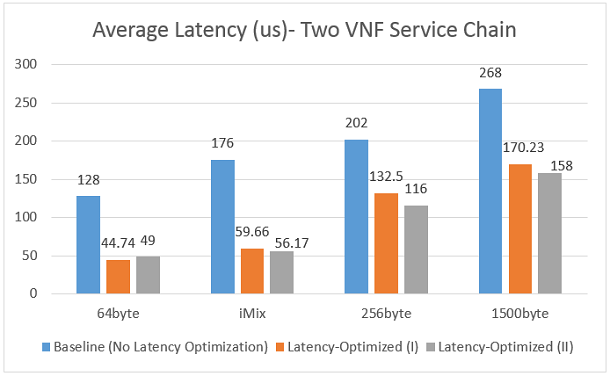
Figure 5: Five-minute average latency results in microseconds for two VNFs (lower is better).
The results for average latency across the range of packet profiles clearly show significantly improved performance (lower average latency) in the optimized cases. As would be expected, the dual VNF case involves higher overall latency results for both testbeds due to more packet switches between the VNF instances, and through the virtual switches within the hypervisor. It is instructive to explore in more detail the results for a specific packet profile scenario; for example, the 256-byte packet tests are closely representative of voice-over-IP frames generated using the Real-time Transport Protocol (RTP) with G.711 encoding.9 Figure 6 shows the minimum, average, and maximum one-way latency values for each testbed setup, using the single VNF scenario with 256-byte packets.
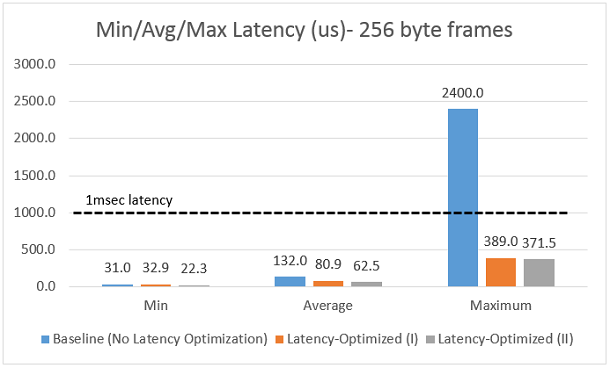
Figure 6: Detailed latency results in microseconds for 256-byte packets.
The test results plotted in Figure 6 demonstrate a 37 percent reduction in average latency from the un-optimized to optimized-I configuration, with a further reduction of 32 percent between optimized-I and optimized-II. For maximum latency, there is an 84 percent reduction between un-optimized and optimized-I, and a further 4.5 percent reduction between optimized-I and optimized-II. This confirms that on top of the significant performance enhancement moving from the un-optimized to optimized setup, there is an additional boost in performance added by fine tuning of the real-time kernel.
The primary focus of subsequent testing was the optimized-II setup, as it uses later versions of system components and achieves the lowest values of latency.
3.2 Virtual Router Soak Testing
Although the results for the latency-optimized setups (Figure 6) suggest sub-millisecond values for both average and maximum latency metrics, it must be noted that five-minute duration tests will be inadequate for detecting drift effects in maximum latency. Longer duration soak tests were carried out on the optimized-II set up to assess the maximum latency measured at discrete time intervals, the plots for which are shown in Figure 7.
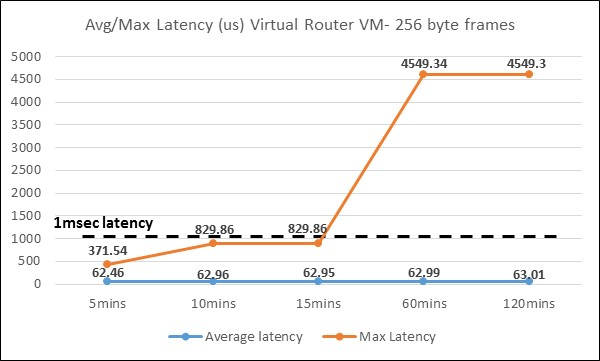
Figure 7: Latency as function of time (virtual router).
The maximum latency profile of Figure 7 clearly shows a tendency toward ~milliseconds values, although the fact that the average latency is very negligibly increased over the same time period confirms that only very isolated packets manifest the high latency. The potential root causes for these latency spikes can be attributed to individual behaviors of the VNFs, and/or housekeeping characteristics of the Linux operating system, causing somewhat hard to predict interrupt scenarios.
3.3 Skeleton Application for Baselining Infrastructure Latency
In order to baseline the infrastructure contribution to overall latency—infrastructure in this context being the physical compute plus the hypervisor domain—a simple, minimal function skeleton application was produced based on a Fedora virtual machine (VM). This VM was configured to forward packets in a bridged (or pass-through) fashion between two virtual interfaces connected using virtual networks/bridges as part of the OVS with DPDK instance in the optimized-II setup.
Initially, five-minute tests were carried out using the range of packet profiles, and compared with the virtual router testing as shown in Figure 8. As can be seen, the skeleton application—providing an indicative representation of baseline infrastructure latency—has notably lower values than the virtual router VNF. It can be deduced that for the optimized-II setup using OVS 2.4.9 in conjunction with DPDK 2.1.0, a baseline value of average latency for the NFVI of between 9.5 and 13us is achievable (packet profile dependent), with the additional VNF contribution being between three and six times those figures. Specifically, for the average latency measurements, the virtual router VNF has an additional average latency contribution of ~21us (for 64-byte and iMix tests), ~53us (for 256-byte tests) and ~72us (for 1500-byte tests).
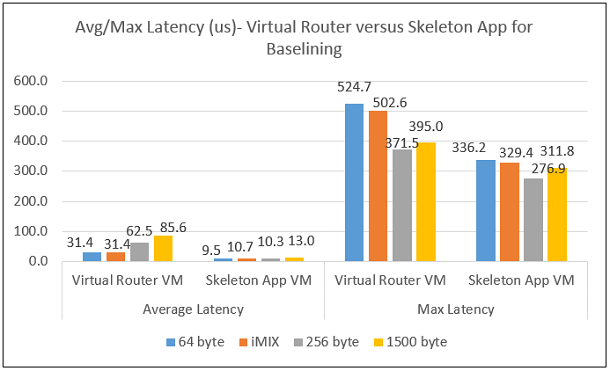
Figure 8: Five-minute average and maximum latency comparison.
As discussed earlier in the paper, maximum latency requires a longer duration analysis (for example, extending from five minutes to two hours) to ensure that the effects of latency spikes are taken into account. Figure 9 shows the average and maximum latency for the skeleton application, plotted for the same two-hour period as used in the virtual router test plotted in Figure 7.
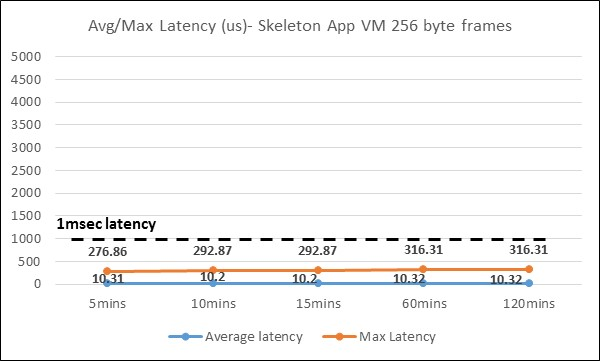
Figure 9: Latency as function of time (skeleton application).
As can be seen, the maximum latency stays well within a millisecond and, at the 120-minute point, is still only 0.316 milliseconds. Comparing with the corresponding maximum latency for the virtual router (4.5msec, as shown in Figure 7), suggests a representative VNF contribution of ~4.2msec for this particular packet profile (256-byte frames). The corresponding average latency is around 10.3us which, when compared with that of the virtual router (~63us), indicates a representative VNF contribution of around 53us for this particular packet profile (256-byte frames).
Testing of the skeleton application was extended to a 12-hour period (thus providing a view of baseline NFVI latency contribution over a longer period of time), for both 256-byte and iMix packet profiles. As shown in Figure 10, in both cases an average latency of around 10us is observed with the maximum value of 0.38msec for iMix and 0.72msec for 256-byte packet profiles; both well within the 1-msec boundary.
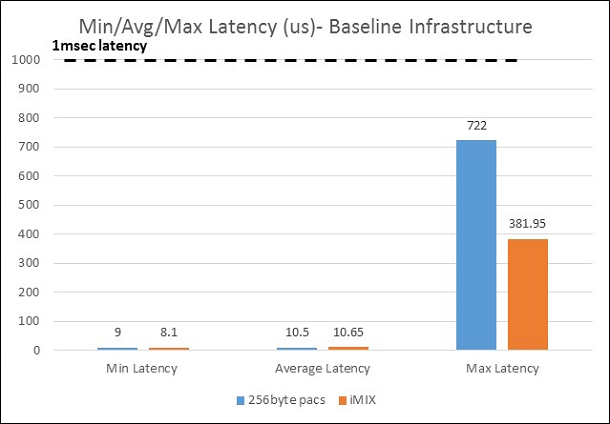
Figure 10: Min/avg/max latency for 12-hour period.
The results in this section highlight the efficacy of using a simple skeleton application to provide insights into both the baseline values of average and maximum latency contributed by the NFV infrastructure, as well as typical VNF contributions.
3.4 Out-of-Sequence Frames
One of the unexpected consequences of the testing was observed occurrences of OOS frames. This occurred on the optimized-I setup with its particular mix of system components, but was subsequently eliminated on the optimized-II setup, which involved later variants of OVS and DPDK, and had further tuning of the real-time kernel. Percentage values of OOS for optimized-I and optimized-II setups are provided in Table 2 across the range of packet profiles tested, and plotted for five-minute tests.
| Latency-Optimized-I | Latency-Optimized-II | |
|---|---|---|
| 64 byte | 0.2% | 0% |
| 256 byte | 0.006% | 0% |
| iMix | 11.8% | 0% |
| 1500 byte | 0.00012% | 0% |
Table 2: OOS percentage for optimized platforms.
To ensure OOS was not introduced at a later point, much longer duration tests were carried out and they all confirmed that for the optimized-II setup, zero OOS was observed. Figure 11 shows the test results for the skeleton application using 256-byte packets, measured over 40 hours. They confirm both the fact that the maximum latency has not drifted beyond its 12-hour value of 0.72ms, and also that zero OOS frames occur; this is for a total frame count of 1.6 billion.

Figure 11: 40-hour testing of skeleton app using 256-byte frames.
These results have two important consequences:
- It is strongly recommended that performance characterization of NFV infrastructure, including low-latency testing, always includes OOS as a KPI. It should be zero, but must be checked using the appropriate test equipment, that this is indeed the case. In real-world scenarios, OOS will impact on customer experience for a number of applications, including voice and video.
- A baseline NFVI build using open source ingredients including Linux-based KVM hypervisor, OVS, DPDK, and so on, should be fine-tuned and set up as close as possible to the optimized-II setup described in this paper.
4. Summary and Conclusions
Since 5G will have a number of latency-critical applications, and implementation of certain 5G components will be underpinned by NFVI, it is vital to be able to accurately characterize and fine-tune the NFVI to understand its contribution to latency. This paper has outlined a novel open source testing framework to enable a unique blend of performance characterizations. This included the use of a skeleton application packet forwarding instance to enable visibility of the baseline contribution made by the NFVI (physical compute + hypervisor), as well as indicative VNF contributions. Furthermore, the difference between average and maximum latency values was explored by conducting longer duration soak tests, as well as the potential occurrence of OOS frames.
The key findings can be summarized as follows:
- For latency-sensitive (such as sub-millisecond) 5G applications running on NFVI using open source components such as Linux-based KVM hypervisor (including real-time kernel), Open Vswitch with DPDK, and so on, a baseline build should be fine-tuned and set up as close as possible to the optimized-II framework setup described in this paper: this is based on the Intel ONP 2.0 framework, which also aligns closely with the OPNFV Brahmaputra architectural release.8
- While VNFs have their own individual contribution to latency (depending on the application itself), the tests in this paper indicate a baseline contribution of NFVI (compute + hypervisor) of around 10us average latency, with maximum value no worse than 722us.
- It is strongly recommended that performance characterization of NFVI, including low-latency testing, always includes OOS frame count as a KPI.
Further areas for research include:
- Investigation into max latency spiking and root causes, including analysis of data collated over longer time periods and frequency distributions.
- Analysis of latency characterization for multiple VNFs, with specific noisy neighbor behavior taken into account.
- End-to-end latency characterization across 5G spectrum of components (RAN, CN, and so on), as well as virtual and non-virtual components.
- Impact of the enablement of Cache Allocation Technology.
References
- 5G Vision, The 5G Infrastructure Public Private Partnership: The Next Generation of Communication Networks and Services.
- 5G Radio Access for Ultra-Reliable and Low-Latency Communications, Osman Yilmaz, Ericsson Research Blog, May 2015.
- The Tactile Internet, ITU-T Technology Watch Report, August 2014.
- ICT Consolidation in 5G: the Role of Software Networks, Panel Session 3, EUCNC 2016, Athens.
- Network Function Virtualization in 5G, S. Abdelwahab et al., IEEE Communications Magazine, April 2016.
- OPNFV- NFV-KVM-Fine-Tuning, Mark Beirel, March 2016.
- Real-Time Linux Wiki.
- What is OPNFV and How Does Intel® ONP Align, Michael Lynch, February 2016.
- NFV Performance Benchmarking for vCPE, Network Test Report, Overture Networks, May 2015.