What is a Roofline Model?
A Roofline chart is a visual representation of application performance in relation to hardware limitations, including memory bandwidth and computational peaks. In 2013, this model was improved by researchers at the Technical University of Lisbon in a paper called “Cache-Aware Roofline Model: Upgrading the Loft.” Traditionally, Roofline charts have been calculated and plotted manually, but Intel® Advisor now automatically builds Roofline plots.
The Roofline provides insight into:
- Where your performance bottlenecks are
- How much performance is left on the table because of them
- Which bottlenecks are possible to address, and which ones are worth addressing
- Why these bottlenecks are most likely occurring
- What your next steps should be
While the Roofline chart is not a conversion table that directly tells you exactly what changes need to be made in your code, it is an incredibly useful diagnosis tool. In the same way that a doctor uses a patient’s symptoms to determine what tests to run in order to diagnose the illness (and from there, what to prescribe), a developer can use the Roofline to guide them to what they should investigate next (and from there, what optimizations to make), using the rest of the tools provided in Intel® Advisor, ensuring that they can squeeze the maximum performance out of their code with minimal time and effort.
Collecting Roofline Data
 At its most fundamental level, a Roofline chart is simply the byproduct of adding FLOPS data to an Intel® Advisor survey report. Once both these components are present, Advisor will automatically create a Roofline chart. Therefore, running a Survey analysis and then manually running a Trip Counts analysis with FLOPS collection enabled is functionally identical to using the Collect Roofline shortcut button in the GUI of both the standalone and integrated versions of the product.
Prior to Intel® Advisor 2018 update 1, no equivalent to the shortcut button existed on the command line, necessitating the manual collection of both component analyses with separate commands.
advixe-cl -collect survey -project-dir MyResults -- MyExecutable
advixe-cl -collect tripcounts -flops-and-masks -project-dir MyResults -- MyExecutable
Note that the -flops-and-masks flag was deprecated in Intel® Advisor 2018 update 1, which streamlined the process for running the analyses separately as well as adding a single shortcut command.
advixe-cl -collect survey -project-dir MyResults -- MyExecutable
advixe-cl -collect tripcounts -flop -project-dir MyResults -- MyExecutable

advixe-cl -collect roofline -project-dir MyResults -- MyExecutable
It should be noted that the shortcut command may not be used to collect data on Intel® MPI applications; the Survey and FLOPS must be collected separately. More information on using Advisor with MPI applications is available here.
mpirun -n 1 -gtool "advixe-cl -collect survey -project-dir MyResults:0" MyExecutable
mpirun -n 1 -gtool "advixe-cl -collect tripcounts -flop -project-dir MyResults:0" MyExecutable
Understanding a Roofline Chart
Reading the Roofline
The Roofline is plotted with the X axis as Arithmetic Intensity (measured in FLOPs/Byte) and the Y axis as the performance in GFLOPs/Second, both in logarithmic scale. Before collecting data on your program, Intel® Advisor automatically runs some quick benchmarks to measure the hardware limitations of your machine, which it then plots as the lines on the chart, called roofs.
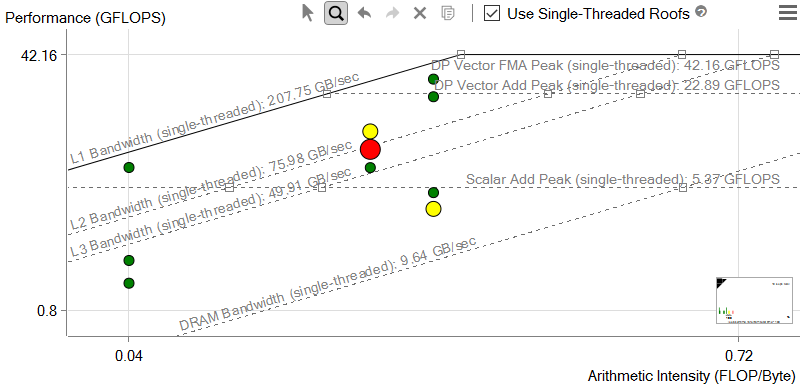
The horizontal lines represent the number of floating point computations of a given type your hardware can perform in a given span of time. The diagonal lines are representative of how many bytes of data a given memory subsystem can deliver per second.
Each dot is a loop or function in your program, with its position indicating its performance, which is affected by its optimization, and its Arithmetic Intensity. It is important to note that Intel® Advisor uses a cache-aware roofline model. In classic roofline, a kernel’s Arithmetic Intensity would change with problem size or cache usage optimization, because the byte count was based on DRAM traffic only. This is not so in cache-aware Roofline, where it is a fixed value tied to the algorithm itself – it only changes when the algorithm itself is altered, either by the programmer or occasionally by the compiler.
TIP: The Roofline chart in Intel® Advisor is highly customizable for maximum readability. You can show or hide specific roofs or alter the way loops/functions are displayed on the chart with the options menu accessible from the three horizontal lines in the upper right hand corner of the chart, as well as changing what data is displayed with Advisor's filter features.
Interpreting the Data
In general, the farther a dot is from the topmost roofs, the more room for improvement there is. In accordance with Amdahl’s Law, optimizing the loops that take the largest portion of the program’s total run time will lead to greater speedups than optimizing the loops that take a smaller portion of the run time.
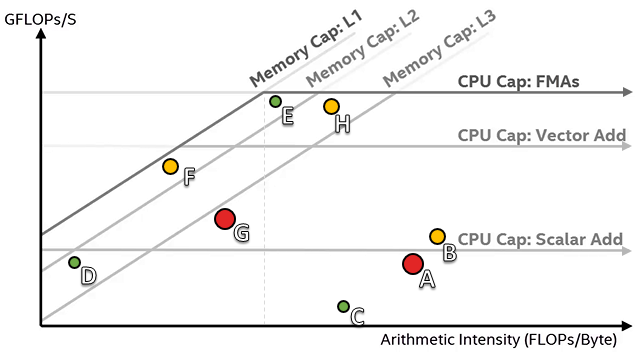
The size and color of the dots in Intel® Advisor’s Roofline chart indicates how much of the total program time a loop or function takes. Small, green dots take up relatively little time, so are likely not worth optimizing. Large, red dots take up the most time, so the best candidates for optimization are the large, red dots with a large amount of space between them and the topmost roofs.
In this example image, loops A, G, and (to a lesser extent) B are the best candidates for optimization, while loops E, C, D, and H are poor candidates.
The roofs above a dot represent the restrictions preventing it from achieving a higher performance, although the roofs below can contribute somewhat. Each roof represents the maximum performance achievable without taking advantage of a particular optimization, which is associated with the next roof up. For example, the Scalar Add Peak represents the maximum possible performance without taking advantage of vectorization, as indicated by the next roof up being the Vector Add Peak.
Of course, this means that some algorithms are incapable of breaking certain roofs. For instance, if Loop A in the example above cannot be vectorized due to dependencies, it cannot break the Scalar Add Peak.
TIP: If you can’t break a memory roof, try to rework your algorithm for higher arithmetic intensity. This will move you to the right and give you more room to increase performance before hitting the memory bandwidth roof. This would be the appropriate approach to optimizing loop F in the example, as well as loop G if its cache usage cannot be improved.
These are generalizations and simplifications, of course. In reality, the position of a loop on the chart is not always a direct indicator of what optimization to make, but it does provide a very reliable guide to what you should investigate next. A loop near (as B) or under (as A) the Scalar Add Peak indicates that you should check whether the loop vectorized – if so, you should investigate the vector efficiency; if not, you should investigate whether it can be vectorized at all. Likewise, a loop that is under a memory roof, such as G in the example, should have its memory access patterns investigated.
For a more in-depth explanation of how to interpret the Roofline results, watch the Roofline walkthrough video. For a more hands-on experience, follow along with the official Roofline Tutorial. For information about using Roofline with Callstacks, read the Roofline with Callstacks article.
Where can I get Intel® Advisor with Rooflines?
Roofline is a feature of Intel® Advisor beginning officially with version 2017 Update 2. It is also available as a preview feature in Intel® Advisor 2017 Update 1. Intel® Advisor is part of the Parallel Studio XE suite (Cluster Edition and Professional Edition only).
If you already own Intel® Advisor under a license that qualifies you for an update that includes the Roofline analysis, visit the Registration Center to download and install your update.
For more information on getting started with Intel® Advisor Roofline, see the Getting Started Guide.