Processor Cores Underutilization: OpenMP* Serial Time
This recipe shows how to identify a fraction of serial execution in an application parallelized with OpenMP, discover additional opportunities for parallelization, and improve scalability of the application.
Content expert : Dmitry Prohorov
A fraction of Serial time in a parallel application is one of the factors that limits application scalability, which is an ability of the application to utilize available hardware resources, such as cores, for executing the application code. Accoring to Amdahl's law, the maximum speed-up for a parallel application, where P is a parallel portion of the application execution and N is a number of processor elements, is 1/((1-P)+(P/N)). So, the more (1-P) - a serial part of the application execution, - the further you are from a linear speed-up with a growing number of N - a number of processor elements - being limited with the serial part of execution.
When your application is parallelized with OpenMP, the sequential code execution may be a result of the code executed out of OpenMP regions or executed inside #pragma omp master or #pragma omp single constructs. This recipe focuses on the first case detection. Consider following these steps to detect the time of the code executed outside of OpenMP regions, analyze the distribution on serial hotspot functions/loops, and understand opportunities for code parallelization with the Intel® VTune™ Amplifier.
DIRECTIONS:
Ingredients
This section lists hardware and software tools used for the performance analysis scenario.
Application: a miniFE Finite Element Mini-Application that is available for download from https://github.com/Mantevo/miniFE (OpenMP version)
Compiler: Intel® Compiler 13 Update 5 and later. This recipe relies on this compiler version to have necessary instrumentation inside Intel OpenMP runtime library used by the VTune Amplifier for analysis.
Performance analysis tools:
Intel VTune Amplifier 2019: HPC Performance Characterization analysis
NOTE:Starting with the 2020 release, Intel® VTune™ Amplifier has been renamed to Intel® VTune™ Profiler.
Most recipes in the Intel® VTune™ Profiler Performance Analysis Cookbook are flexible. You can apply them to different versions of Intel® VTune™ Profiler. In some cases, minor adjustments may be required.
Get the latest version of Intel® VTune™ Profiler:
From the Intel® VTune™ Profiler product page.
Download the latest standalone package from the Intel® oneAPI standalone components page.
Intel® Inspector 2019: Threading Error analysis
NOTE:To download the latest version of Intel® Inspector, visit the download page.
Operating system: Linux*, Ubuntu* 16.04 LTS
CPU: Intel Xeon® CPU E5-2699 v4 @ 2.20GHz
Create a Baseline
Use the openmp/src/Makefile.intel.openmp make file to build the application. Add -g and -parallel-source-info=2 compiler options to enable debug information and provide source file information in OpenMP region names, which makes their identification easier.
Running the compiled application with nx=200, ny=200, and nz=200 parameters, the number of OpenMP threads corresponding to the number of physical cores and with one thread running per core (OMP_NUM_THREADS=44, OMP_PLACES=cores) takes about 12 seconds. This is a performance baseline that could be used for further optimizations.
Run HPC Performance Characterization Analysis
To have a high-level understanding of potential performance bottlenecks for the sample, start with the HPC Performance Characterization analysis provided by the VTune Amplifier:
Click the New Project button on the toolbar and specify a name for the new project, for example: miniFE.
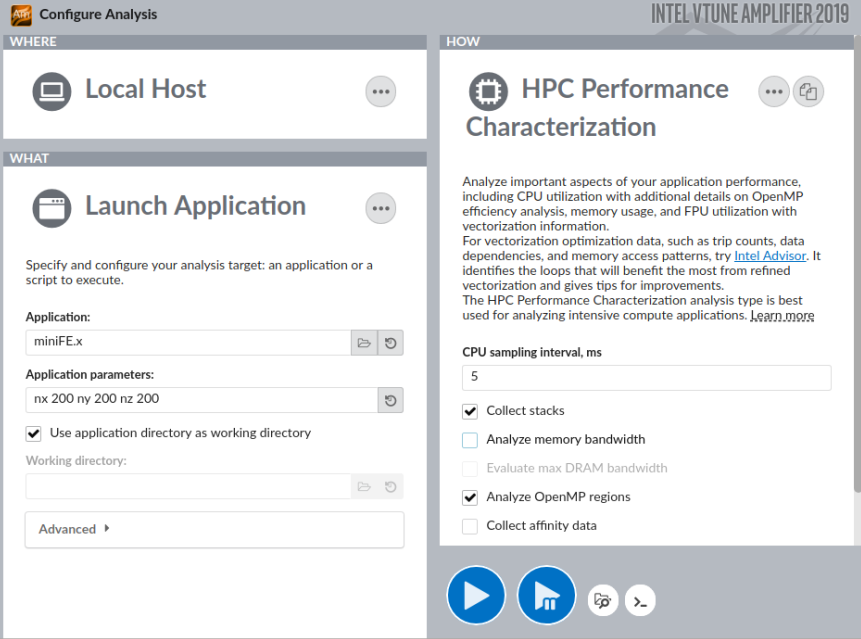
The Configure Analysis window opens.
On the WHERE pane, select the Local Host target system type.
On the WHAT pane, select the Launch Application target type and specify an application for analysis and its parameters: nx 200 ny 200 nz 200.
On the HOW pane, click the browse button and select HPC Performance Characterization from the Parallelism group.
Click the
 Start button to run the analysis.
You can also run the analysis from the command line:
amplxe-cl -collect hpc-performance -data-limit=0 ./miniFE.x nx 200 ny 200 nz 200VTune Amplifier launches the application, collects data, and processes the data collection result resolving symbol information, which is required for successful source analysis.
Identify OpenMP Serial Time
HPC Performance Characterization analysis collects and shows important HPC metrics that help understand such performance bottlenecks as CPU utilization (parallelism), memory access efficiency, and vectorization. For applications using the Intel OpenMP runtime, as in this recipe, you can benefit from special OpenMP efficiency metrics that help identify issues with threading parallelism.
Start your analysis with the Summary view that displays application-level statistics. Flagged Effective Physical Core Utilization metric (on some systems just CPU Utilization) signals a performance problem that should be explored:

When you dive deeper to the metric hierarchy, you see that the Serial Time (outside parallel regions) of the application occupies ~25% of its elapsed time. The main serial hotspot is in the matrix initialization code.
Consider running the HPC Performance Characterization analysis with call stacks to explore available optimization opportunities. Call stacks can help to find a candidate for parallelism at a proper level of granularity. Since the call stack collection is not compatible with memory bandwidth analysis, make sure to disable the Analyze memory bandwidth configuration option:
To run the same configuration from the command line, enter:
amplxe-cl -collect hpc-performance -data-limit=0 -knob enable-stack-collection=true -knob collect-memory-bandwidth=false ./miniFE.x nx 200 ny 200 nz 200
NOTE:
You can also analyze OpenMP Serial Time with stacks by running the Threading analysis. But HPC Performance Characterization might be more preferable as a starting point when you do not know which performance aspects have bottlenecks.
To identify top hotspots and explore their call stacks, switch to the Bottom-up view and sort it by Serial CPU Time column:

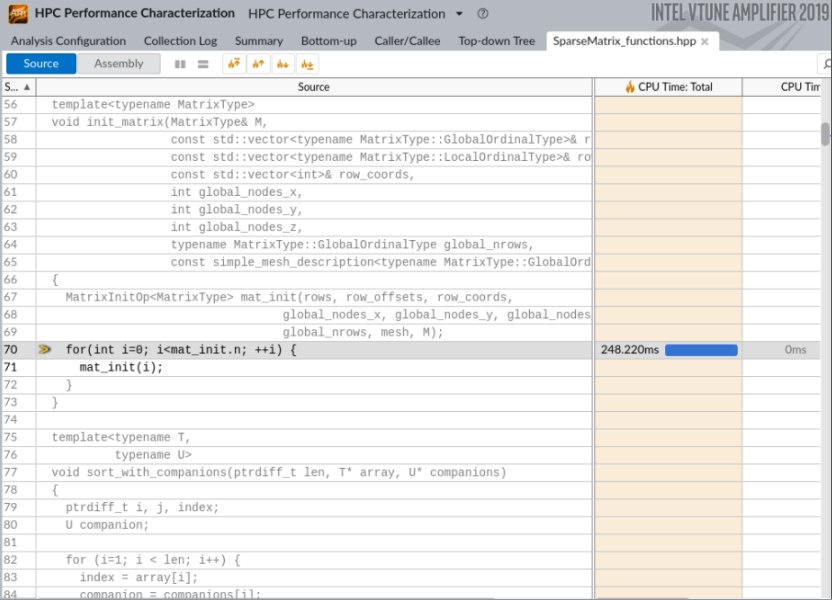
You see that the right place to insert parallelism is line 70 in SparseMatrix_functions.hpp where there is a loop with iterations by matrix elements.
Double-click the row on the Call Stack pane to open the source file automatically positioned on the hottest line of the top hotspot loop:
Parallelize the Code
Insert the omp parallel for pragma to make the matrix initialization parallelized by OpenMP:
#pragma omp parallel for
for(int i=0; i<mat_init.n; ++i) {
    mat_init(i);
Re-compile the application and compare the execution time versus the original performance baseline to verify your optimization.
In this recipe, the Elapsed time of the application after optimization is approximately 10 seconds, which is ~16% speed-up of the application execution.
Re-run the HPC Performance Characterization analysis for the optimized version of the application:

Overall Effective Physical Core Utilization has improved by 10%. The fraction of OpenMP Serial Time is reduced to 9% and it is not flagged by VTune Amplifier as an issue (the threshold for the metric is 15%).
To further improve parallel efficiency, you can analyze the most imbalanced barriers as shown in the OpenMP Imbalance and Scheduling Overhead Cookbook recipe.
Inspect Threading Errors
To complete your analysis for parallelism, check your code for threading errors like data races or deadlocks. To do this, the recipe uses the Intel Inspector, which is able to find even potential data races and deadlocks that might not happen on application runs on particular hardware but can hurt in another environment or even on the same environment with different settings.
If you use the command line interface and reduce the workload size, the check runs faster but still is representative:
inspxe-cl -collect ti3 ./miniFE.x nx 40 ny 40 nz 40You see that the Intel Inspector does not report any issues for the parallelized code.

NOTE:
To discuss this recipe, visit the developer forum.
Parent topic: Tuning Recipes