Visible to Intel only — GUID: GUID-A23A3F87-8EE2-452B-9492-AA76B14E60BE
Prepare Application for Analysis
Windows* Targets
Linux* Targets
Embedded Linux* Targets
FreeBSD* Targets
QNX* Targets
Managed Code Targets
Android* Targets
Intel® Xeon Phi™ Processor Targets
Targets in Virtualized Environments
Targets in a Cloud Environment
Arbitrary Targets
Embedded System Targets
Build and Install the Sampling Drivers for Linux* Targets
Debug Information for Linux* Application Binaries
Compiler Switches for Performance Analysis on Linux* Targets
Enable Linux* Kernel Analysis
Resolution of Symbol Names for Linux-Loadable Kernel Modules
Analyze Statically Linked Binaries on Linux* Targets
Set Up Remote Linux* Target
User-Mode Sampling and Tracing Collection
Hardware Event-based Sampling Collection
Performance Snapshot
Algorithm Group
Microarchitecture Analysis Group
Parallelism Analysis Group
Input and Output Analysis
Accelerators Analysis Group
Platform Analysis Group
Hybrid CPU Analysis
Source Code Analysis
Custom Analysis
Energy Analysis
Code Profiling Scenarios
Control Data Collection
Manage Data Views
Manage Result Files
Analyze Platform Performance
Analyze Topology and Hardware Resource Utilization
Analyze Platform I/O Bandwidth
Analyze Efficiency of Intel® Data Direct I/O Utilization
Analyze Utilization of Intel® Virtualization Technology for Directed I/O
Analyze MMIO Access
Analyze Memory, Persistent Memory, and Cross-Socket Bandwidth
Analyze DPDK Applications
Analyze SPDK Applications
Analyze Linux Kernel I/O
Switch Viewpoints
Control Window Synchronization
View Stacks
Manage Grid Views
Manage Timeline View
Change Threshold Values
Choose Data Format
Group and Filter Data
View Data on Inline Functions
Analyze Loops
Stitch Stacks for Intel® oneAPI Threading Building Blocks or OpenMP* Analysis
Search for Data
performance-snapshot Command Line Analysis
hotspots Command Line Analysis
anomaly-detection Command Line Analysis
threading Command Line Analysis
memory-consumption Command Line Analysis
hpc-performance Command Line Analysis
uarch-exploration Command Line Analysis
memory-access Command Line Analysis
tsx-exploration Command Line Analysis
tsx-hotspots Command Line Analysis
sgx-hotspots Command Line Analysis
gpu-hotspots Command Line Analysis
gpu-offload Command Line Analysis
graphics-rendering Command Line Analysis
fpga-interaction Command Line Analysis
io Command Line Analysis
system-overview Command Line Analysis
platform-profiler Command Line Analysis
runsa/runss Custom Command Line Analysis
Configure Analysis Options from Command Line
Collect System-Wide Data from Command Line
Collect Data on Remote Linux* Systems from Command Line
Configure GPU Analysis from Command Line
Specify Search Directories from Command Line
Specify Result Directory from Command Line
Pause Collection from Command Line
Manage Analysis Duration from Command Line
Limit Data Collection from Command Line
Option Descriptions and General Rules
allow-multiple-runs
analyze-kvm-guest
analyze-system
app-working-dir
call-stack-mode
collect
collect-with
column
command
cpu-mask
csv-delimiter
cumulative-threshold-percent
custom-collector
data-limit
discard-raw-data
duration
filter
finalization-mode
finalize
format
group-by
help
import
inline-mode
knob
kvm-guest-kallsyms
kvm-guest-modules
limit
loop-mode
mrte-mode
no-follow-child
no-summary
no-unplugged-mode
quiet
report
report-knob
report-output
report-width
result-dir
resume-after
return-app-exitcode
ring-buffer
search-dir
show-as
sort-asc
sort-desc
source-object
source-search-dir
stack-size
start-paused
strategy
target-install-dir
target-system
target-tmp-dir
target-duration-type
target-pid
target-process
time-filter
trace-mpi
user-data-dir
verbose
version
Best Practices: Resolve Intel® VTune™ Profiler BSODs, Crashes, and Hangs in Windows* OS
Error Message: Application Sets Its Own Handler for Signal
Error Message: Cannot Enable Event-Based Sampling Collection
Error Message: Cannot Collect GPU Hardware Metrics
Error Message: Cannot Collect GPU Hardware Metrics for the Selected GPU Adapter
Error Message: Cannot Load Data File
Error Message: Cannot Locate Debugging Information
Error Message: Cannot Open Data
Error Message: Client Is Not Authorized to Connect to Server
Error Message: Root Privileges Required for Processor Graphics Events
Error Message: No Pre-built Driver Exists for This System
Error Message: Not All OpenCL™ API Profiling Callbacks Are Received
Error Message: Problem Accessing the Sampling Driver
Error Message: Required Key Not Available
Error Message: Scope of ptrace System Call Is Limited
Error Message: Stack Size Is Too Small
Error Message: Symbol File Is Not Found
Problem: Analysis of the .NET* Application Fails
Problem: Cannot Access VTune Profiler Documentation
Problem: CPU time for Hotspots or Threading Analysis is Too Low
Problem: 'Events= Sample After Value (SAV) * Samples' Is Not True If Multiple Runs Are Disabled
Problem: Guessed Stack Frames
Problem: GUI Hangs or Crashes
Problem: Inaccurate Sum in the Grid
Problem: Information Collected via ITT API Is Not Available When Attaching to a Process
Problem: No GPU Utilization Data Is Collected
Problem: Same Functions Are Compared As Different Instances
Problem: Skipped Stack Frames
Problem: Stack in the Top-Down Tree Window Is Incorrect
Problem: Stacks in Call Stack and Bottom-Up Panes Are Different
Problem: System Functions Appear in the User Functions Only Mode
Problem: VTune Profiler is Slow to Respond When Collecting or Displaying Data
Problem: VTune Profiler is Slow on X-Servers with SSH Connection
Problem: Unexpected Paused Time
Problem: {Unknown Timer} in the Platform Power Analysis Viewpoint
Problem: Unknown Critical Error Due to Disabled Loopback Interface
Problem: Unknown Frames
Problem: Unreadable Text on macOS*
Problem: Unsupported Microsoft* Windows* OS
Warnings about Accurate CPU Time Collection
Context Menu: Grid
Context Menus: Call Stack Pane
Context Menus: Project Navigator
Context Menus: Source/Assembly Window
Dialog Box: Binary/Symbol Search
Dialog Box: Source Search
Hot Keys
Menu: Customize Grouping
Menu: Intel VTune Profiler
Pane: Call Stack
Pane: Options - General
Pane: Options - Result Location
Pane: Options - Source/Assembly
Project Navigator
Pane: Timeline
Toolbar: Configure Analysis
Toolbar: Filter
Toolbar: Source/Assembly
Toolbar: Intel VTune Profiler
Window: Bandwidth - Platform Power Analysis
Window: Bottom-up
Window: Caller/Callee
Window: Cannot Find <file type> File
Window: Collection Log
Window: Compare Results
Window: Configure Analysis
Window: Core Wake-ups - Platform Power Analysis
Window: Correlate Metrics - Platform Power Analysis
Window: CPU C/P States - Platform Power Analysis
Window: Debug
Window: Event Count - Hardware Events
Window: Flame Graph
Window: Graphics - GPU Compute/Media Hotspots
Window: Graphics C/P States - Platform Power Analysis
Window: NC Device States - Platform Power Analysis
Window: Platform
Window: Platform Power Analysis
Window: Sample Count - Hardware Events
Window: SC Device States - Platform Power Analysis
Window: Summary
Window: System Sleep States - Platform Power Analysis
Window: Temperature/Thermal Sample - Platform Power Analysis
Window: Timer Resolution - Platform Power Analysis
Window: Top-down Tree
Window: Uncore Event Count - Hardware Events
Window: Wakelocks - Platform Power Analysis
Window: Summary - Input and Output Summary
Window: Summary - Microarchitecture Exploration
Window: Summary - GPU Analysis
Window: Summary - Hardware Events
Window: Summary - Hotspots by CPU Utilization
Window: Summary - HPC Performance Characterization
Window: Summary - Memory Consumption
Window: Summary - Memory Usage
Window: Summary - Platform Power Analysis
Average Time
Computing Threads Started
Computing Threads Started, Threads/sec
CPU Time
EU 2 FPU Pipelines Active
EU Array Active
EU Array Idle
EU Array Stalled/Idle
EU Array Stalled
EU IPC Rate
EU Send pipeline active
EU Threads Occupancy
Global
GPU EU Array Usage
GPU L3 Bound
GPU L3 Miss Ratio
GPU L3 Misses
GPU L3 Misses, Misses/sec
GPU Memory Read Bandwidth, GB/sec
GPU Memory Texture Read Bandwidth, GB/sec
GPU Memory Write Bandwidth, GB/sec
GPU Texel Quads Count, Count/sec
GPU Utilization
Instance Count
L3 Sampler Bandwidth, GB/sec
L3 Shader Bandwidth, GB/sec
LLC Miss Rate due GPU Lookups
LLC Miss Ratio due GPU Lookups
Local
Maximum GPU Utilization
Occupancy
PS EU Active %
PS EU Stall %
Ratio to Max Bandwidth, %
Ratio to Max Bandwidth, %
Ratio to Max Bandwidth, %
Render/GPGPU Command Streamer Loaded
Samples Blended
Samples Killed in PS, pixels
Samples Written
Sampler Busy
Sampler Is Bottleneck
Shared Local Memory Read Bandwidth, GB/sec
Shared Local Memory Write Bandwidth, GB/sec
SIMD Width
Size
Total, GB/sec
Total Time
Typed Memory Read Bandwidth, GB/sec
Typed Memory Write Bandwidth, GB/sec
Typed Reads Coalescence
Typed Writes Coalescence
Untyped Memory Read Bandwidth, GB/sec
Untyped Memory Write Bandwidth, GB/sec
Untyped Reads Coalescence
Untyped Writes Coalescence
VS EU Active
VS EU Stall
Visible to Intel only — GUID: GUID-A23A3F87-8EE2-452B-9492-AA76B14E60BE
Analyze Platform Performance
Understand the platform-level metrics provided by the Input and Output analysis of Intel® VTune™ Profiler.
The Input and Output analysis provides platform-level metrics designed to:
- Analyze platform I/O traffic on per-I/O-device basis, whether the I/O device is an external PCIe device or an integrated accelerator.
- Analyze efficiency of Intel® Data Direct I/O technology (Intel® DDIO) utilization.
- Analyze Intel® Virtualization Technology for Directed I/O (Intel® VT-d) utilization.
- Monitor DRAM and persistent memory bandwidth consumption.
- Identify I/O performance issues potentially caused by inefficient remote socket accesses.
- Identify sources of outbound I/O (MMIO) traffic.
To get this information, start the analysis with these options enabled:
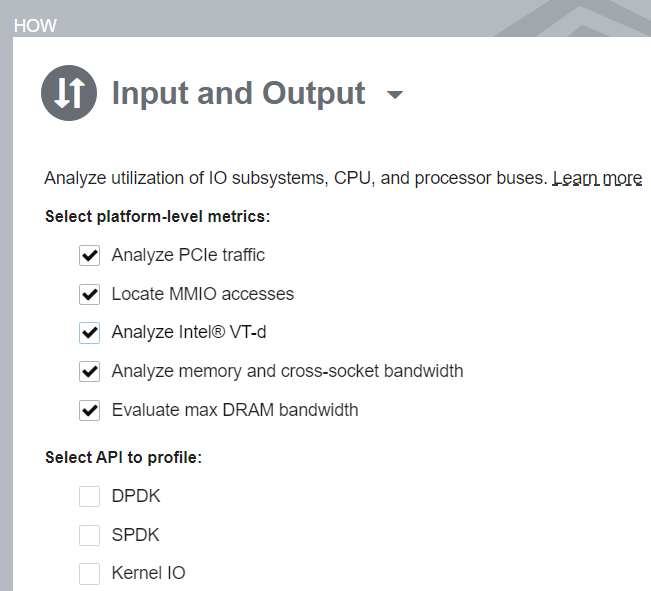
Analyze Topology and Hardware Resource Utilization
Once the data collection finishes, VTune Profiler opens the default Summary window.
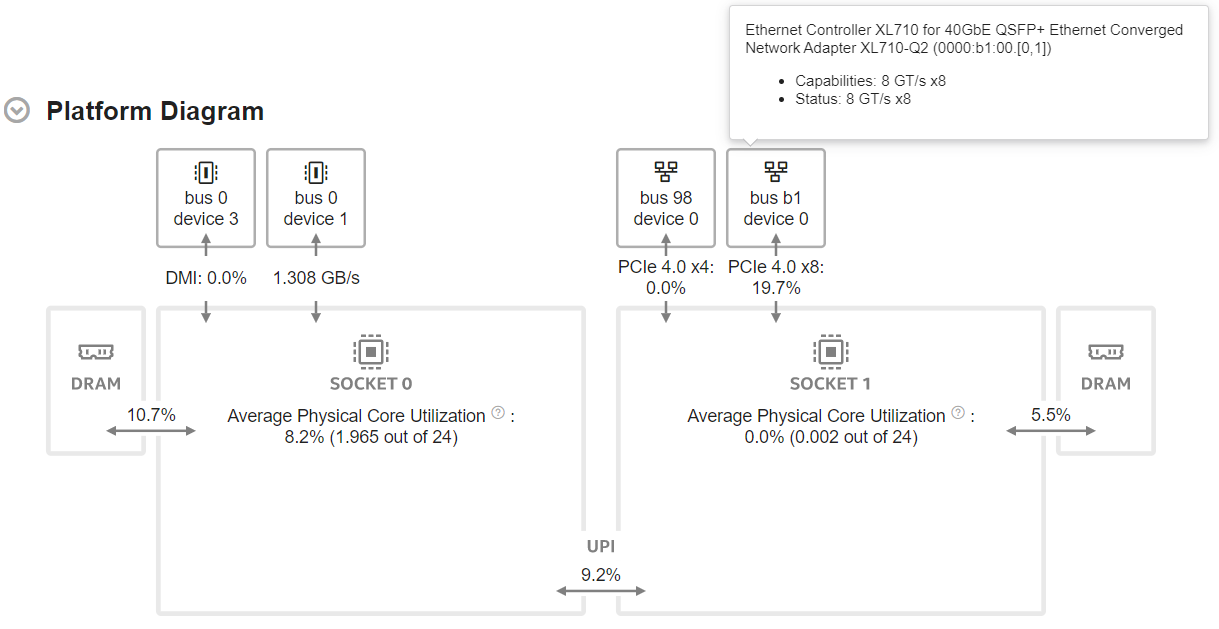
Start your investigation with the Platform Diagram section of the Summary window. The Platform Diagram presents system topology and utilization metrics for I/O and Intel® UPI links, DRAM, persistent memory, and physical cores.
Example of a Platform Diagram for a two-socket server with an active network interface card (NIC) on socket 1 and active Intel® QuickData Technology (CBDMA) on socket 0:
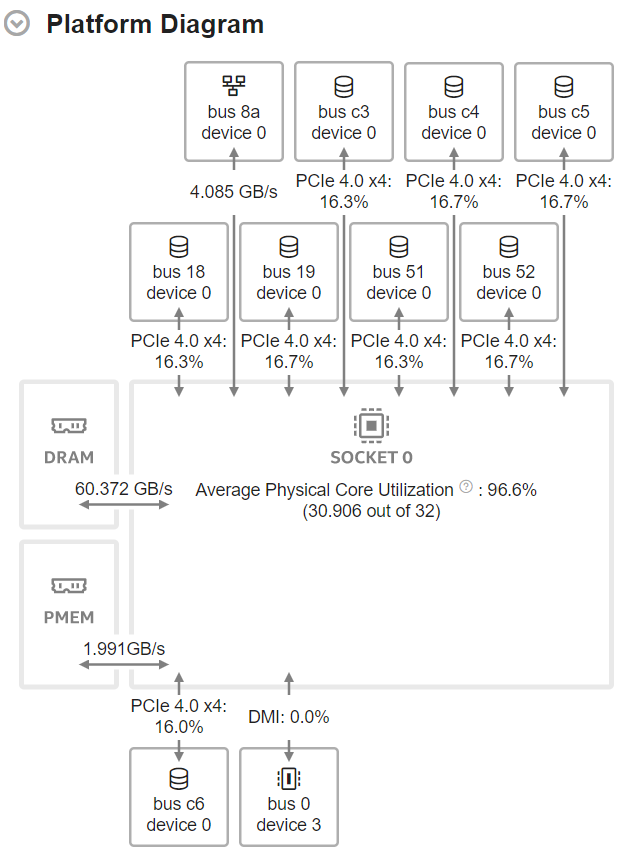
Example of a Platform Diagram for a single-socket server with 8 active NVMe SSDs, network intefrace card, and persistent memory:
NOTE:
The Platform Diagram is available starting with server platforms based on Intel® microarchitecture code named Skylake, with up to four sockets.
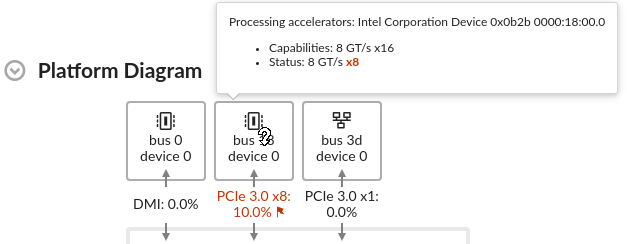
I/O devices are shown with short names that indicate the PCIe bus and device numbers. Full device name, link capabilities, and status are shown in the device tooltip. Hover over the device image to see detailed device information.
The Platform Diagram highlights device status issues that may be a reason of limited throughput. A common issue is that the configured link speed/width does not match the maximum speed/width of the device.
When device capabilities are known and the maximum physical bandwidth can be calculated, the device link is attributed with the Effective Link Utilization metric that represents the ratio of bandwidth consumed on data transfers to the available physical bandwidth. This metric does not account for protocol overhead (TLP headers, DLLPs, physical encoding) and reflects link utilization in terms of payloads. Thus, it cannot reach 100%. However, this metric can give a clue on how far from saturation the link is. Maximum theoretical bandwidth is calculated for device link capabilities as shown in the device tooltip.
The Platform Diagram shows the Average DRAM Utilization when the Evaluate max DRAM bandwidth checkbox is selected in the analysis configuration. Otherwise, it shows the average DRAM bandwidth.
If the system is equipped with persistent memory, the Platform Diagram shows the Average Persistent Memory Bandwidth.
The Average UPI Utilization metric reveals UPI utilization in terms of transmit. The Platform Diagram shows a single cross-socket connection, regardless of how many UPI links connect a pair of packages. If there is more than one link, the maximum value is shown.
The Average Physical Core Utilization metric, displayed on top of each socket, indicates the utilization of physical cores by computations of the application being analyzed.
Once you examine topology and utilization, drill down into the details to investigate platform performance.
Analyze Platform I/O Bandwidth
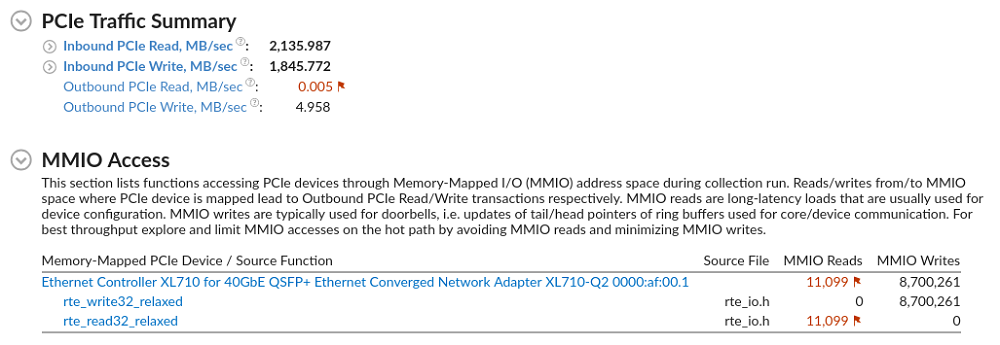
To explore I/O traffic processing on the platform, start your investigation with the PCIe Traffic Summary section of the Summary window. These top-level metrics reflect the total Inbound and Outbound I/O traffic:
Inbound PCIe Bandwidth is induced by I/O devices—whether external PCIe devices and/or integrated accelerators—that write to and read from the system memory. These reads and writes are processed by the platform through the Intel® Data Direct I/O (Intel® DDIO) feature.
Inbound PCIe Read — the I/O device reads from the platform memory.
Inbound PCIe Write — the I/O device writes to the platform memory.
Outbound PCIe Bandwidth is induced by core transactions targeting the memory or registers of the I/O device. Typically, the core accesses the device memory through the Memory-Mapped I/O (MMIO) address space.
Outbound PCIe Read — the core reads from the registers of the device.
Outbound PCIe Write — the core writes to the registers of the device.
NOTE:
- The Inbound PCIe Bandwidth metrics are only available for server platforms based on Intel® microarchitecture code named Sandy Bridge EP and newer.
- The Outbound PCIe Bandwidth metrics are only available for server platforms based on Intel® microarchitecture code named Haswell EP and newer.
The granularity of Inbound and Outbound PCIe Bandwidth metrics depends on CPU model, collector used, and user privileges. For details, see the Platform-Level Metrics table.
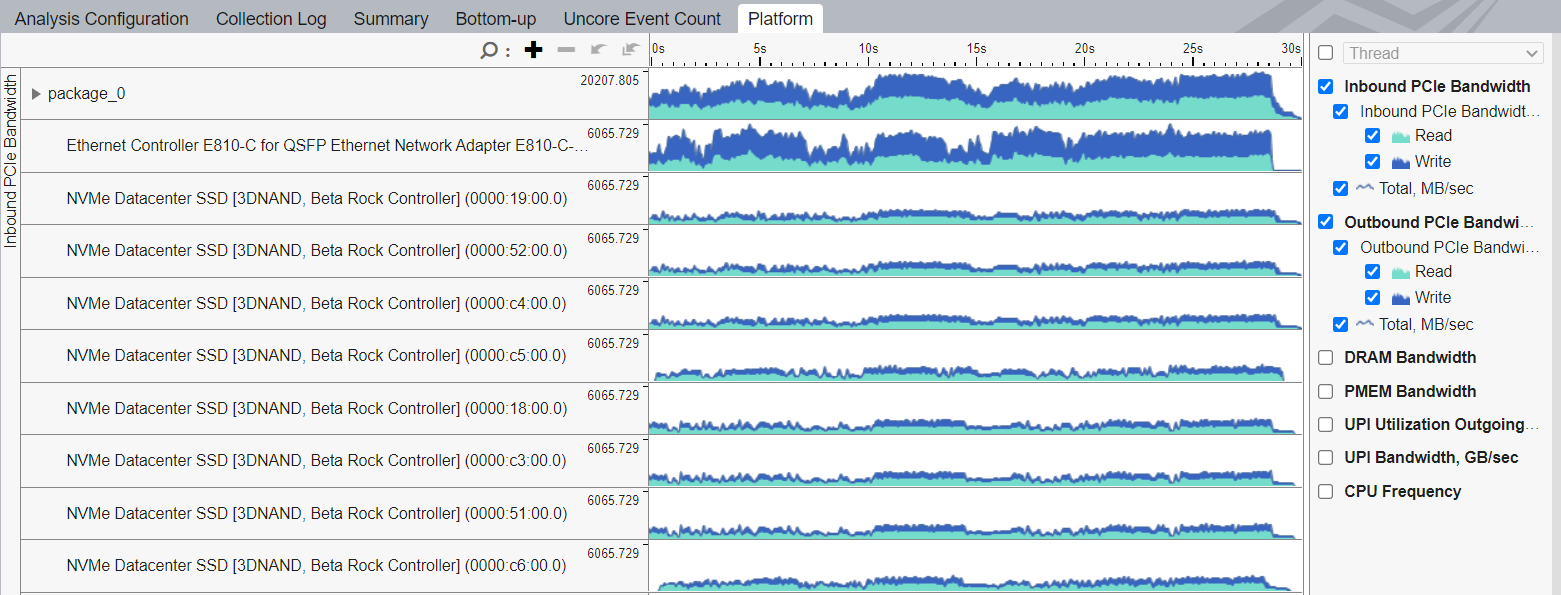
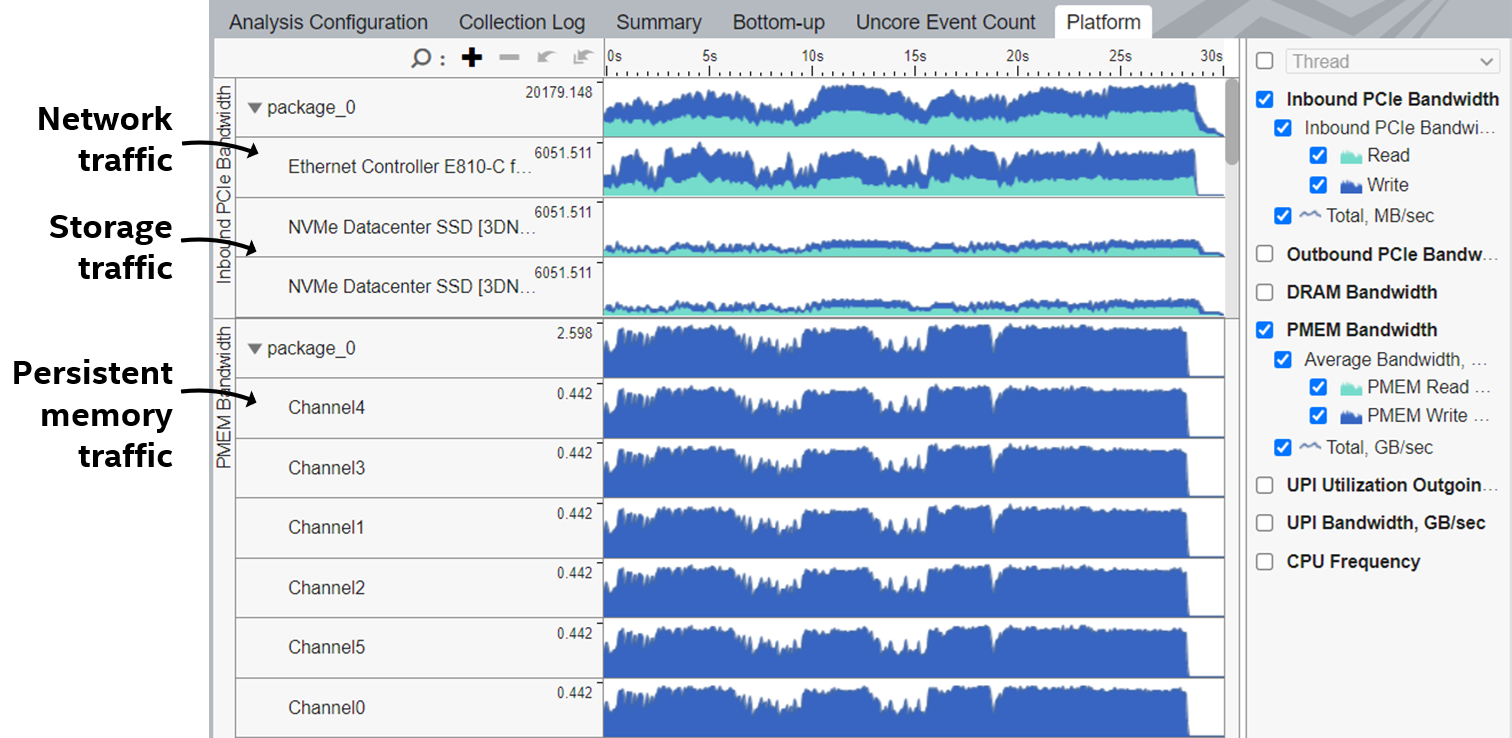
You can analyze the Inbound and Outbound PCIe Bandwidth over time on a per-device basis using the timeline in the Bottom-up or the Platform tabs:
Analyze Efficiency of Intel® Data Direct I/O Utilization
To understand whether your application utilizes Intel® DDIO efficiently, explore the second level metrics in the PCIe Traffic Summary section.
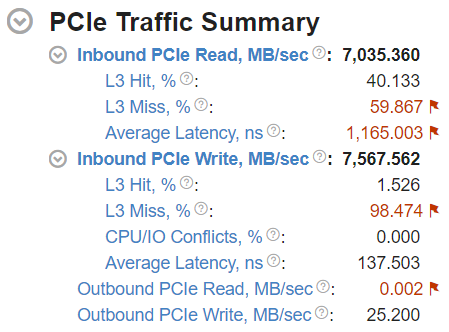
The L3 Hit/Miss Ratios for Inbound I/O requests reflect the proportions of requests made by I/O devices to the system memory that hit/miss the L3 cache. For a detailed explanation of Intel® DDIO utilization efficiency, see the Effective Utilization of Intel® Data Direct I/O Technology Cookbook recipe.
NOTE:
L3 Hit/Miss metrics are available for Intel® Xeon® processors code named Haswell and newer.
The Average Latency metric of the Inbound PCIe read/write groups shows an average amount of time the platform spends on processing inbound read/write requests for a single cache line.
The CPU/IO conflicts ratio shows a portion of Inbound I/O write requests that experienced contention for a cache line between the IO controller and some other agent on the CPU, which can be a core or another IO controller. These conflicts are caused by the simultaneous access to the same cache line. Under certain conditions, such access may cause the IO controller to lose ownership of this cache line. This forces the IO controller to reacquire the ownership of this cache line. Such issues can occur in applications that use the polling communication model, resulting in suboptimal throughput and latency. To resolve this, consider tuning the Snoop Response Hold Off option of the Integrated IO configuration of UEFI/BIOS (option name may vary depending on platform manufacturer).
NOTE:
Average Latency for inbound I/O reads/writes and CPU/IO Conflicts metrics are available on Intel® Xeon® processors code named Skylake and newer.
The granularity of DDIO efficiency metrics—second-level metrics for Inbound I/O bandwidth—depends on CPU model, collector used, and user privileges. For details, see the Platform-Level Metrics table.
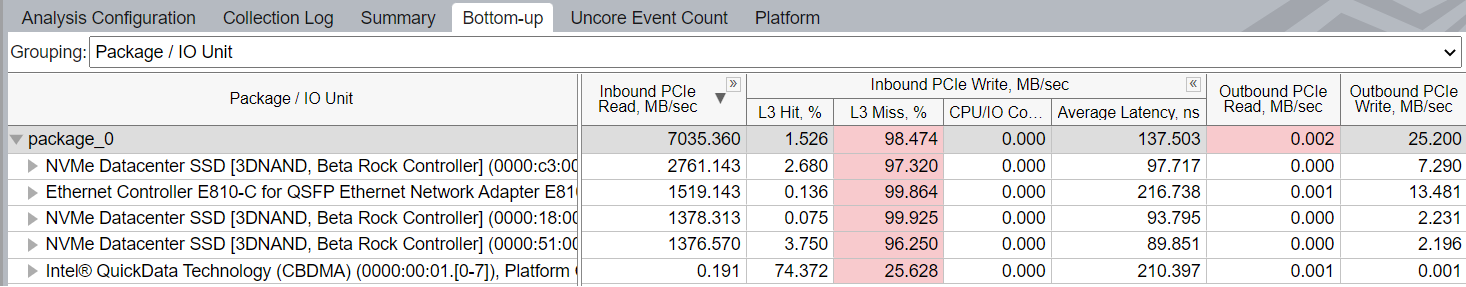
You can get a per-device breakdown for Inbound and Outbound Traffic, Inbound request L3 hits and misses, Average latencies, and CPU/IO Conflicts using the Bottom-up pane with the Package / M2PCIe or Package / IO Unitgrouping:
Analyze Utilization of Intel® Virtualization Technology for Directed I/O
To understand how your workload utilizes the Intel® Virtualization Technology for Directed I/O (Intel VT-d), explore Intel® VT-d section of the result Summary tab. Intel VT-d enables addresses remapping for Inbound I/O requests.
NOTE:
Intel VT-d metrics are available starting with server platforms based on Intel® microarchitecture code named Ice Lake.
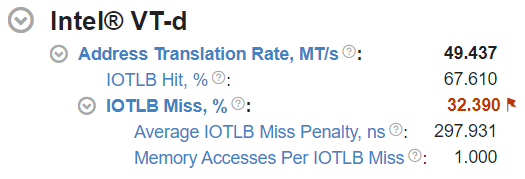
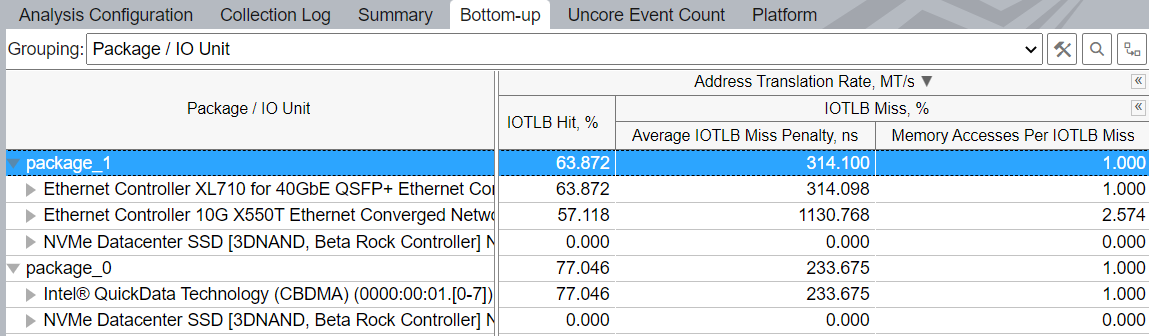
The top-level metric shows the average total Address Translation Rate.
The IOTLB (I/O Translation Lookaside Buffer) is an address translation cache in the remapping hardware unit that caches effective translations from virtual addresses, used by devices, to host physical addresses. IOTLB lookups happen on address translation requests. The IOTLB Hit and IOTLB Miss metrics reflect the ratios of address translation requests hitting and missing the IOTLB.
The next-level metrics for IOTLB misses are:
- Average IOTLB Miss Penalty, ns — average amount of time spent on handling an IOTLB miss. Includes looking up the context cache, intermediate page table caches and page table reads (page walks) on a miss, which turn into memory read requests.
- Memory Accesses Per IOTLB Miss — average number of memory read requests (page walks) per IOTLB miss.
The granularity of Intel VT-d metrics depends on CPU model, collector used, and user privileges. For details, see the Platform-Level Metrics table. When prerequisites are met, Intel VT-d metrics can be viewed per sets of I/O devices—PCIe devices and/or integrated accelerators. Each set includes all devices handled by the single I/O controller, which commonly serves 16 PCIe lanes. Switch to the Bottom-up window and use Package / IO Unit grouping:
Analyze MMIO Access
Outbound I/O traffic visible in the PCIe Traffic Summary section of the Summary tab is caused by cores writing to and reading from memory/registers of I/O devices.
Typically, cores access I/O device memory through the Memory-Mapped I/O (MMIO) address space. Each load or store operation targeting the MMIO address space that an I/O device is mapped to causes outbound I/O read or write transactions respectively. When performed through the usual load and store instructions, such memory accesses are quite expensive, since they are affected by the I/O device access latency. Therefore, such accesses should be minimized to achieve high performance. The latest Intel architectures incorporate direct store instructions (MOVDIR*) which may enable high rate for MMIO writes, usually used for job submission or "doorbell rings".
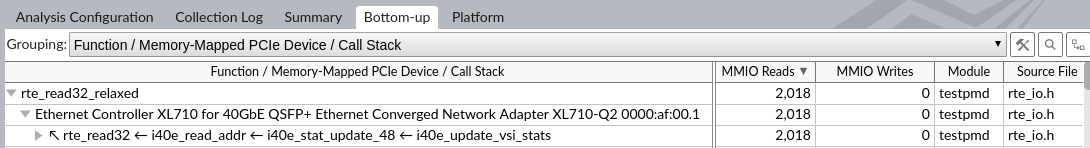
Enable the Locate MMIO accesses option during analysis configuration to detect the sources of outbound traffic. Use the MMIO Access section to locate functions performing MMIO Reads and MMIO Writes that target specific PCIe devices.
Use the Bottom-up pane to locate sources of memory-mapped PCIe device accesses. Explore the call stacks and drill down to source and assembly view:
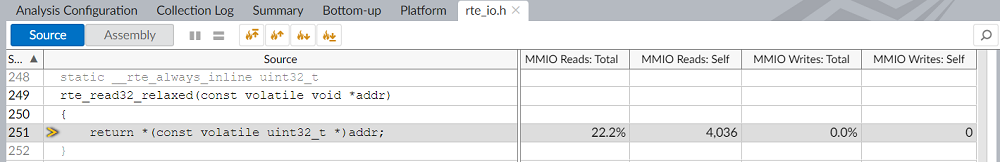
Double click on the function name to drive into source code or assembly view to locate the code responsible for MMIO reads and writes at source line level:
NOTE:
MMIO access data is collected when the Locate MMIO accesses check box is selected. However, there are some limitations:
This feature is only available starting with server platforms based on the Intel® microarchitecture code name Skylake.
Only Attach to Process and Launch Application collection modes are supported. When running in the Profile System mode, this option only reveals functions performing reads from uncacheable memory.
Analyze Memory, Persistent Memory, and Cross-Socket Bandwidth
Use the Platform tab to correlate I/O traffic with DRAM, PMEM (persistent memory) and cross-socket interconnect bandwidth consumption:
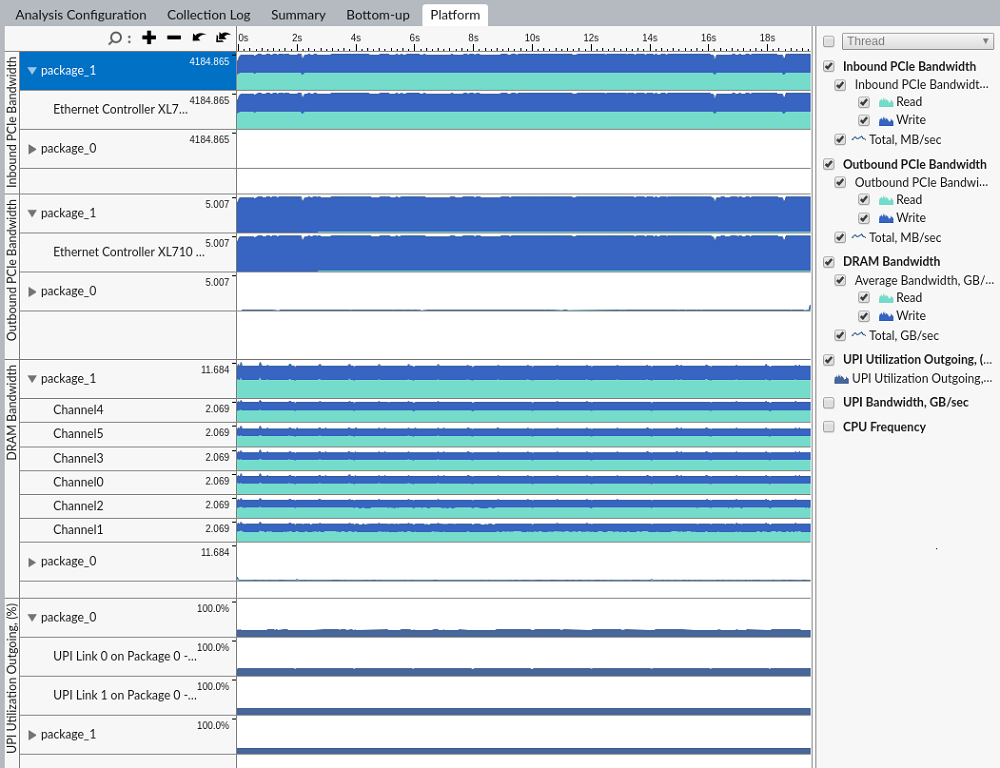
VTune Profiler provides per-channel breakdown for DRAM and PMEM bandwidth:
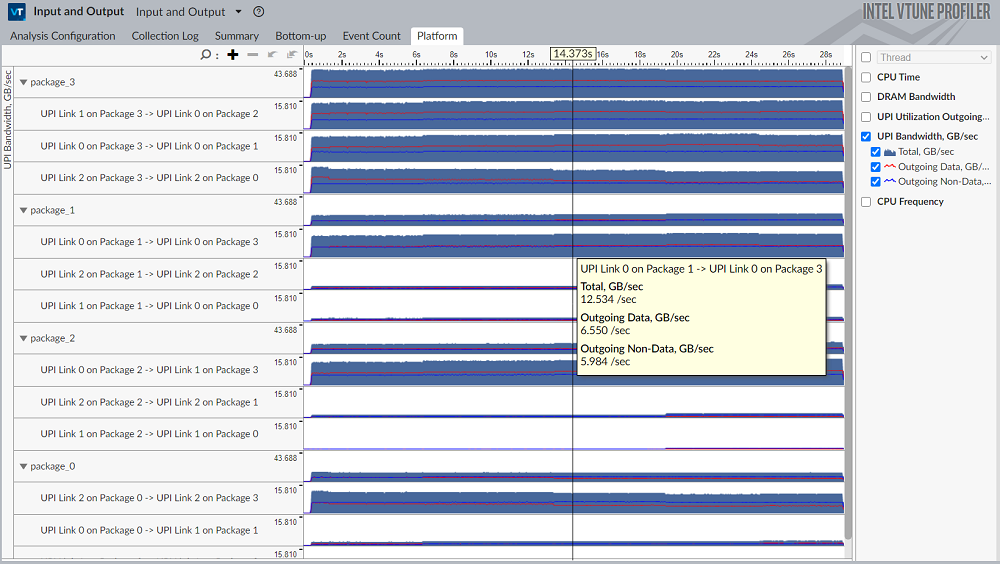
Two metrics are available for Intel® UPI traffic:
- UPI Utilization Outgoing – ratio metric that shows UPI utilization in terms of transmit.
- UPI Bandwidth – shows detailed bandwidth information with breakdown by data/non-data.
You can get a breakdown of UPI metrics by UPI links. See the specifications of your processor to determine the number of UPI links that are enabled on each socket of your processor.
UPI link names reveal the topology of your system by showing which sockets and UPI controllers they are connected to.
Below is an example of a result collected on a four-socket server powered by Intel® processors with microarchitecture code named Skylake. The data reveals significant UPI traffic imbalance with bandwidth being much higher on links connected to socket 3:
Parent topic: Input and Output Analysis