Visible to Intel only — GUID: GUID-7D3806B7-D440-4207-94AB-E61977DDE6FA
Visible to Intel only — GUID: GUID-7D3806B7-D440-4207-94AB-E61977DDE6FA
Context Menu
The context menu in the Collective Operations Profile mainly consists of the following entries:
| Select This: | To Do This: |
|---|---|
| Attribute to show | Select the attributes to be shown in the Collective Operations Profile |
| Columns to show | Select if to display Collective Operations Profile by process, by root or by communicator. |
| Rows to show | Choose whether the rows of the profile show the Collective Operation, the communicator or the root values. |
| Sort | Sort rows by the values of the column clicked on, or sort columns by the values in a row clicked on and switch back to the default order. It is also useful to switch back to the default order if the columns or rows were rearranged by dragging the row or column headers around. |
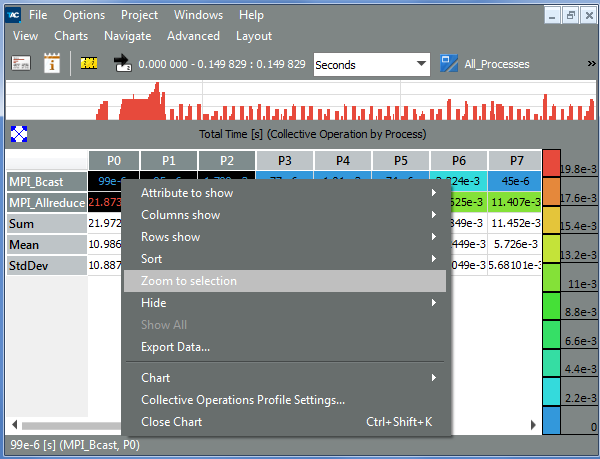
| Zoom to selection | Use this entry to focus on a particular region in the matrix. To do this, select the required region with the mouse, right-click the selection and choose the Zoom to selection entry from the context menu. See the example. As a result, only the selected region is displayed. |
| Hide | Hide all selected cells. To select the necessary cells, hold down the left mouse button and move over the required region. It also automatically opens the context menu. |
| Show All | Display all the hidden cells. It is enabled only if cells have been previously hidden using the Hide entry. |
| Export Data | Open an Export Text dialog box and select a file to store textual data in. This includes all data cells that contain at least one message, even if they are currently hidden. For each cell, all available attributes are given. It does not contain row or column statistics. |
| Collective Operations Profile Settings | Open the Collective Operations Profile Settings dialog box |
Zooming to Selection in Collective Operations Profile:
