Analyze Performance After Optimization
In this step, run the Performance Snapshot analysis again to profile the application with loop interchange enabled.
To see the improvement provided by using the loop interchange technique, run the Performance Snapshot analysis again.
NOTE:
Depending on your compiler and IDE, when configuring the analysis, you may need to browse to a different executable that was generated during recompilation in the previous step. For example, by default, Visual Studio* places the executable in [matrix]\vc15\x64\Release.
Once the sample application finishes, the Performance Snapshot Summary window opens.
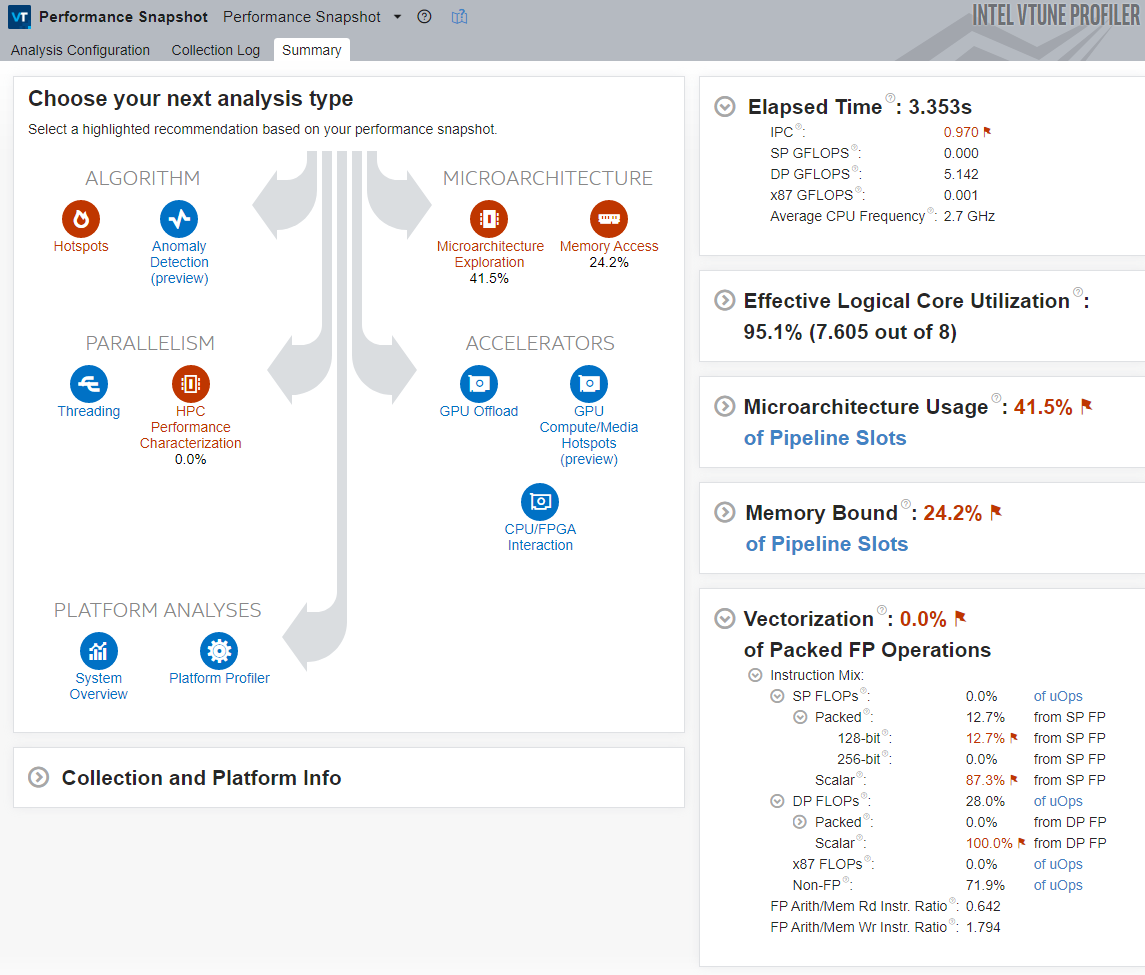
Observe these main indicators:
The Elapsed Time for the application is significantly reduced. This improvement is mainly the result of the eliminated memory access bottleneck, which caused the processor to frequently miss the cache and request data from the DRAM, which is very expensive in terms of latency.
The Vectorization metric is equal to 0.0%, which means that the code was not vectorized. Due to this, Performance Snapshot highlights the HPC Performance Characterization analysis as a potential next step.
In this case, the code was not vectorized because the Intel® oneAPI DPC++/C++ Compiler does not perform vectorization when compiling with binary size favored (/O1).
To enable automatic vectorization by the compiler through Visual Studio, follow these steps:
Right-click the matrix project and select Properties.
In the C/C++ > Optimization menu, set the Optimization option to Maximum Optimization (Favor Speed) (/O2).
Save the configuration changes.
Build the application.
Next step: Analyze Vectorization Efficiency.