Fuzzing is a common technique used by hackers to find vulnerabilities, where random inputs are sent to expose mistakes in code. However, with the source code and information about the software under attack, crashes and bugs can be mapped back for easier fixing. Intel’s Excite project uses a combination of symbolic execution, fuzzing, and concrete testing find vulnerabilities in sensitive code. Developers can use Simics* virtual platforms to adopt best practices from the project to combine symbolic and concrete techniques to achieve better performance and effectiveness than using either technique alone.

Finding vulnerabilities in code is part of the constant security game between attackers and defenders. An attacker only needs to find one opening to be successful, while a defender needs to search for and plug all or at least most of the holes in a system. Thus, a defender needs more effective tools than the attacker to come out ahead.
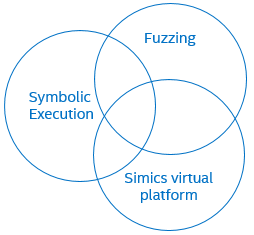
The Excite project at Intel empowers defenders by combining a dynamic selective symbolic execution and guided fuzzing for test case generation. It uses the Wind River* Simics virtual platform to dump platform-dependent data and code, and to replay tests while checking for security issues and measuring coverage to guide the next set of tests. Excite operates at the intersection of three technologies: Symbolic Execution, Fuzzing, and Virtual Platforms:
Target: System Management Mode
The current target for the Excite project is analysis of the System Management Interrupt (SMI) handlers in System Management Mode (SMM), as implemented in Unified Extensible Firmware Interface (UEFI) BIOS. Attacks on BIOS have increased, and Intel is stepping up BIOS security with coding guidelines, secure design guidelines, code reviews, and static code analysis. Excite is one more technology for securing the BIOS, by automatically generating tests for bug hunting.
SMM is the most privileged state of execution in an Intel® processor (considered as “Ring -2”, where the OS is at Ring 0 and user applications at Ring 3), and it is a perfect place for a rootkit to place itself. The operating system of the machine does not know when SMM is running and cannot detect or prevent the execution of SMM code. Thus, securing SMM is critical to the security of the platform.
The code and data used by SMM is stored in System Management RAM (SMRAM). SMRAM is a part of the system RAM that is dedicated for SMM usage, protected by mechanisms in the processor. SMM is entered via System Management Interrupt (SMI) calls, triggered by platform-specific events.
When an SMI happens, a Communications Buffer (comm buffer) is used to pass parameters from the outside. The comm buffer is stored in regular RAM and must be assumed to be potentially under the control of adversaries. Thus, SMI handlers must be very careful to check and validate the information in a comm buffer to not be misled into doing things that would help an attacker.
SMI handlers can access any memory in the machine, and as such, they have great power to cause trouble. A UEFI BIOS sets up tables that define the memory that SMI handlers should access, and the memory they should not.
SMM is part of a UEFI BIOS; it is not a static component. During the boot, the BIOS will dynamically load SMM drivers and their associated SMI handlers into SMRAM. Once setup is complete, SMRAM is locked by setting lock bits in the processor.
Applying Excite to SMM
The testing in Excite aims to catch two particularly nefarious types of issues in UEFI SMI handlers: calls outside of SMRAM, and access out of allowable memory regions. To do this, Excite combines several tools and techniques, tied together into a flow that looks like this:
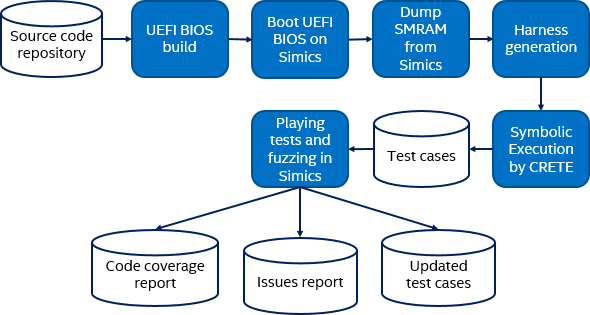
The UEFI BIOS build is standard; no special build flags or variants are needed to enable the use of Excite. Once the BIOS has been built, it is loaded into a Simics virtual platform and booted. With Simics, UEFI code for real platforms can be used, as Simics can simulate real Intel® platforms.
Just after the SMM drivers have initialized, but before SMRAM is locked, Simics dumps an image of SMRAM to be used in the symbolic execution. The advantage of this approach is that the dump contains the initialized state of SMM modules, which eliminates the need to develop a complex model of SMM as would be required if the C source code was used.
The next step is to generate test harnesses. In this stage, Excite scans SMRAM to find all the module registrations and all the handlers. For each handler, a test harness used to invoke the CRETE symbolic execution engine is created (CRETE is an open-source project developed by Portland State University). A test harness maps the SMRAM into the application space where CRETE works. CRETE works on the binary directly – no knowledge of source is needed. The entire comm buffer used as input for the SMI is marked as symbolic and serves as the starting point for the symbolic execution.
CRETE will explore the behavior of each SMI handler and generate test cases for each path it finds. It can easily provide tens of thousands of test cases for a single handler. Each generated test case is a concrete set of data for the comm buffer contents.
The generated test cases are then executed on Simics. As part of running the test cases, code coverage is collected, and any illegal memory accesses or calls are detected.
Symbolic Analysis and Test Generation
Symbolic execution is a powerful technique to systematically explore paths (possibly all) of a software program. Instead of using concrete inputs, symbolic execution executes a program with symbolic inputs. During execution, a symbolic execution engine accumulates a set of constraints on the symbolic inputs. When it encounters branches that depend on symbolic values, it forks two new sets of constraints, one in which the branch condition is true and false in the other one. Upon reaching the end of the program path, the engine sends the constraints to a constraint solver, which generates concrete inputs that will follow this computation path. The process continues until all paths are explored or a termination condition (e.g. timeout) set by the user is reached.
Excite uses CRETE as the symbolic execution engine. The Excite harness calls the CRETE-provided primitives, such as crete_make_symbolic(var, size, name), to mark function inputs or specific memory region for symbolic execution. Then CRETE will explore the memory snapshots from the entry points and generate a test case for each program path it explores. The test cases will include concrete values for the inputs to the function.
The exploration in CRETE will sometimes reveal inputs that would cause the SMI handler to crash. These are marked for future explorations, along with any issues found in the execution on Simics.
How Excite Uses Simics Virtual Platforms
The use of a virtual platform is a prerequisite for the Excite flow. It would not be possible to do this using hardware, since we need the ability to inspect SMRAM at a precise point as well as the ability to jump to arbitrary locations in memory to run test cases. Hardware does not give us the tools we need.
As discussed already, Simics virtual platforms are used for three purposes in Excite:
- Run through the UEFI setup process to get the contents of SMRAM established. Take a Simics checkpoint to save the entire contents of the target machine memory, registers, and device state.
- Access the SMRAM memory once setup is complete and prove a dump to Excite.
- Run the test cases.
Test cases are executed in Simics by loading the checkpoint saved after the boot to get back to the precise state that the UEFI was in after the boot. Then, the processor state and memory state are set up as specified in the test case. This includes copying the contents of the comm buffer as specified in the test case into memory, setting up pointers and size values in registers (R8 and R9).
The instruction pointer (RIP) of the processor core is set to point at the code entry point to directly jump to the SMI handler. There is no need to issue an SMI interrupt to run the code – the SMI interrupt would just pass through a dispatcher and then end up doing the same thing as the test setup. The assumption is that the SMI dispatcher is reliable, and in this way, tests can be run in a way that is simpler to trace.
As the tests are run on Simics, a custom Simics module known as the Execution Tracer (exect) is active. Exect monitors the execution, looking for SMRAM call outs and accesses to illegal memory regions (such as UEFI boot services memory). Thus, exect will detect bad behavior as soon as it happens and provide a bug report to the UEFI developers.
In addition, exect is used to collect code coverage information. This process is non-intrusive, in that the target system can be observed without any change needed to the source code, as is required by some other approaches. By using code coverage, it is possible to measure how much of the SMI code is being tested and to see if more tests increase coverage.
Fuzzing
To further increase coverage, fuzzing techniques similar to those used by the AFL fuzzer are applied to the test cases (AFL itself is not capable of handling UEFI code). The fuzz tests permute and mutate the inputs in the comm buffer of a test case, and then re-run each test on Simics. Test cases that improve code coverage are kept, while others are discarded.
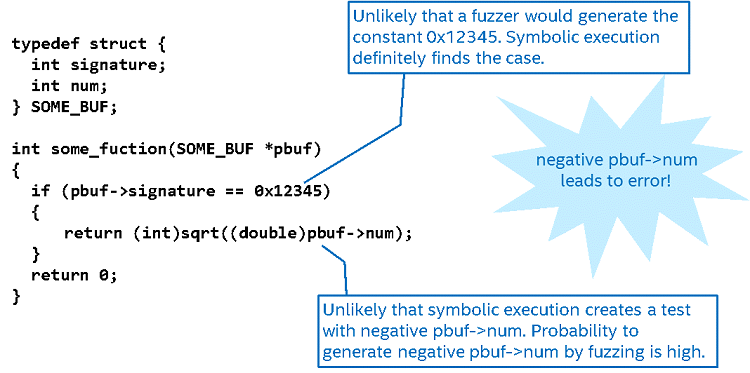
The reason that fuzzing techniques are able to find more tests to run is that the symbolic execution has some limitations and might not generate every possible test case. The symbolic execution also operates only on the comm buffer – there is another state involved that is not part of the comm buffer and thus would not be explored by the symbolic execution.
The picture below provides a simple example of how fuzzing and symbolic execution combine to create better test cases:
Code Coverage Results
If we look at how much of the SMI handler code is being tested, combining symbolic execution and fuzzing provides better coverage than either technique alone. It is noticeable just how much mode code gets tested by guided testing compared to random black-box fuzzing.
| SMM Handler | Baseline1 | Simple BlackBox Fuzzing2 | Symbolic Execution | Symbolic Execution and Fuzzing |
|---|---|---|---|---|
| Handler 1 | 0% | 7% | 88% | 90% |
| Handler 2 | 0% | 5% | 58% | 65% |
| Handler 3 | 49% | 24% | 57% | 60% |
| Handler 4 | 46% | 3% | 51% | 55% |
| Handler 5 | 0% | 38% | 47% | 47% |
- Code coverage is measured in normal boot process after power on
- 50000 random tests
How Issues Get Reported
When issues are found, they are concrete because the UEFI code is run as part of the testing. Issues will materialize as errors at particular points in the code. Unlike purely static analysis approaches that can often generate fairly opaque errors, we get issue reports tied to a particular line of code in a particular concrete system state.
A full stack trace of instructions that perform an illegal access or callout is provided to aid in debugging the issue. The assembly code from the SMRAM dump binary file is mapped back to the corresponding C source using the symbols from the build process (.pdb files) using the ‘dbh’ tool from the Windows Driver Kit (WDK).
With source-code support, the report can point directly at the code where an issue hits, along with the call stack:
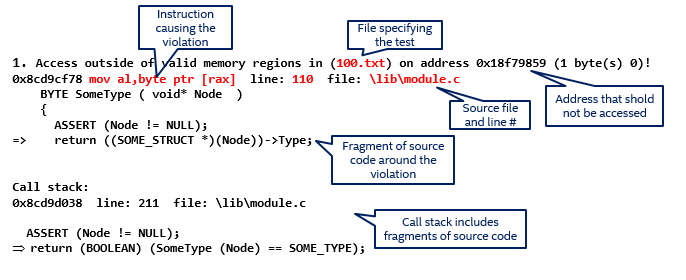
Note Artificial example. Stack trace truncated for illustration, real reports contain the full stack trace.
Debugging a problem like this in a virtual platform is much easier than doing it on hardware. The virtual platform is not itself restricted by mechanisms like locking RAM – from the virtual platform; you can look into the system without the system being aware. It also means that any malware that happens to be on the system will not see a debugger being used (with some caveats), and thus will easier to investigate. Techniques like replaying executions mean that any observed behavior can be repeated reliably – on any host machine.
Optimizing the Execution Time with Parallel Testing
Given the large volume of tests, parallel test execution is used to shorten the overall latency. With 20000 test cases for a particular handler, the total time to generate, run on Simics, and do fuzzing add up to more than 10 hours per handler. With 10 SMI handlers to test, total serial test time would be 100 hours or about four days. However, each SMI handler can be analyzed in parallel, and many tests for each handler can be run in parallel too. Using parallel execution, the total test time can be shrunk to four hours!
The image below shows the increasing amount of parallelism available as we move through the process:
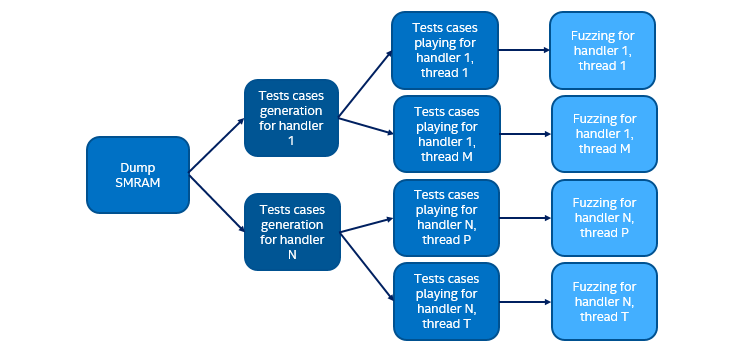
By combining a set of different tools from different categories into an integrated workflow, we get something that none of the tools could achieve on their own. It takes advantage of the unique abilities of virtual platforms to flow data into symbolic execution and generate tests, and then back to the virtual platform to run the tests and investigate their behavior. By adding on fuzzing, the tested space is expanded.
I want to extend a special thank you to Lee Rosenbaum and Zhenkun Yang for helping me write this blog, and kudos to the whole Excite team for building a very cool piece of technology!
Related Content
Presentation about Excite at ZeroNights 2016: Intel’s Ilia Safonov and Alex Matrosov describe Excite, a powerful tool for excavating BIOS security vulnerabilities in an automated fashion.
Cybersecurity and Secure Deployments: how virtual platforms can be useful for cybersecurity.
Ecosystem Partners Shift Left with Intel for Faster Time-to-Market: Intel’s Pre-Silicon Customer Acceleration (PCA) program scales innovation across all operating environments using the Simics virtual platform as a primary technology.
Shifting Left—Building Systems and Software before Hardware Lands: Our shift-left began with efforts to coordinate the co-development of platform hardware and software—one effect was moving software from the end of product development to front and center.
Additional Notes about Temporal Decoupling: Temporal decoupling is a key technology in virtual platforms—it can speed up the execution of a system by several orders of magnitude.
The More the Merrier – Building Virtual Platforms for Integration: To do integration pre-silicon, we need virtual platforms that provide a complete system setup: from the main cores running the main software stacks, to processor cores inside the IP blocks that run firmware.
Author
 Dr. Jakob Engblom is a product management engineer for the Simics virtual platform tool, and an Intel® Software Evangelist. He got his first computer in 1983 and has been programming ever since. Professionally, his main focus has been simulation and programming tools for the past two decades. He looks at how simulation in all forms can be used to improve software and system development, from the smallest IoT nodes to the biggest servers, across the hardware-software stack from firmware up to application programs, and across the product life cycle from architecture and pre-silicon to the maintenance of shipping legacy systems. His professional interests include simulation technology, debugging, multicore and parallel systems, cybersecurity, domain-specific modeling, programming tools, computer architecture, and software testing. Jakob has more than 100 published articles and papers and is a regular speaker at industry and academic conferences. He holds a PhD in Computer Systems from Uppsala University, Sweden.