Introduction
Pin is a tool for the instrumentation of programs. It supports the Linux* and Windows* operating systems and executables for the IA-32, Intel(R) 64 and Intel(R) Many Integrated Core architectures.
Pin allows a tool to insert arbitrary code (written in C or C++) in arbitrary places in the executable. The code is added dynamically while the executable is running. This also makes it possible to attach Pin to an already running process.
Pin provides a rich API that abstracts away the underlying instruction set idiosyncracies and allows context information such as register contents to be passed to the injected code as parameters. Pin automatically saves and restores the registers that are overwritten by the injected code so the application continues to work. Limited access to symbol and debug information is available as well.
Pin includes the source code for a large number of example instrumentation tools like basic block profilers, cache simulators, instruction trace generators, etc. It is easy to derive new tools using the examples as a template.
Tutorial Sections
- How to Instrument With Pin
- Examples
- Callbacks
- Modifying Application Instructions
- Instrumenting multi element instruction operands
- Instrumenting AMX instructions
- Instrumenting IFUNC functions in Linux
- The Pin Advanced Debugging Extensions
- Applying a Pintool to an Application
- Tips for Debugging a Pintool
- Logging Messages from a Pintool
- Performance Considerations
- Memory management
- PinTools Information and Restrictions
- Building Tools on windows
- Libraries for Windows
- Libraries for Linux
- Installation
- Building Your Own Tool
- Pin's makefile Infrastructure
- Feedback
- Disclaimer and Legal Information
Reference Sections
How to Instrument with Pin
Table of Contents
- Pin
- Pintools
- Observations
- Instrumentation Granularity
- Managed platforms support
- Symbols
- Floating Point Support in Analysis Routines
- Instrumenting Multi-threaded Applications
- Avoiding Deadlocks in Multi-threaded Applications
Pin
The best way to think about Pin is as a "just in time" (JIT) compiler. The input to this compiler is not bytecode, however, but a regular executable. Pin intercepts the execution of the first instruction of the executable and generates ("compiles") new code for the straight line code sequence starting at this instruction. It then transfers control to the generated sequence. The generated code sequence is almost identical to the original one, but Pin ensures that it regains control when a branch exits the sequence. After regaining control, Pin generates more code for the branch target and continues execution. Pin makes this efficient by keeping all of the generated code in memory so it can be reused and directly branching from one sequence to another.
In JIT mode, the only code ever executed is the generated code. The original code is only used for reference. When generating code, Pin gives the user an opportunity to inject their own code (instrumentation).
Pin instruments all instructions that are actually excuted. It does not matter in what section they reside. Although there are some exceptions for conditional branches, generally speaking, if an instruction is never executed then it will not be instrumented.
Pintools
Conceptually, instrumentation consists of two components:
- A mechanism that decides where and what code is inserted
- The code to execute at insertion points
These two components are instrumentation and analysis code. Both components live in a single executable, a Pintool. Pintools can be thought of as plugins that can modify the code generation process inside Pin.
The Pintool registers instrumentation callback routines with Pin that are called from Pin whenever new code needs to be generated. This instrumentation callback routine represents the instrumentation component. It inspects the code to be generated, investigates its static properties, and decides if and where to inject calls to analysis functions.
The analysis function gathers data about the application. Pin makes sure that the integer and floating point register state is saved and restored as necessary and allow arguments to be passed to the functions.
The Pintool can also register notification callback routines for events such as thread creation or forking. These callbacks are generally used to gather data or tool initialization or clean up.
Observations
Since a Pintool works like a plugin, it must run in the same address space as Pin and the executable to be instrumented. Hence the Pintool has access to all of the executable's data. It also shares file descriptors and other process information with the executable.
Pin and the Pintool control a program starting with the very first instruction. For executables compiled with shared libraries this implies that the execution of the dynamic loader and all shared libraries will be visible to the Pintool.
When writing tools, it is more important to tune the analysis code than the instrumentation code. This is because the instrumentation is executed once, but analysis code is called many times.
Instrumentation Granularity
As described above, Pin's instrumentation is "just in time" (JIT). Instrumentation occurs immediately before a code sequence is executed for the first time. We call this mode of operation trace instrumentation .
Trace instrumentation lets the Pintool inspect and instrument an executable one trace at a time. Traces usually begin at the target of a taken branch and end with an unconditional branch, including calls and returns. Pin guarantees that a trace is only entered at the top, but it may contain multiple exits. If a branch joins the middle of a trace, Pin constructs a new trace that begins with the branch target. Pin breaks the trace into basic blocks, BBLs. A BBL is a single entrance, single exit sequence of instructions. Branches to the middle of a bbl begin a new trace and hence a new BBL. It is often possible to insert a single analysis call for a BBL, instead of one analysis call for every instruction. Reducing the number of analysis calls makes instrumentation more efficient. Trace instrumentation utilizes the TRACE_AddInstrumentFunction API call.
Note, though, that since Pin is discovering the control flow of the program dynamically as it executes, Pin's BBL can be different from the classical definition of a BBL which you will find in a compiler textbook. For instance, consider the code generated for the body of a switch statement like this
It will generate instructions something like this (for the IA-32 architecture)
In terms of classical basic blocks, each addl instruction is in a single instruction basic block. However as the different switch cases are executed, Pin will generate BBLs which contain all four instructions (when the .L7 case is entered), three instructions (when the .L6 case is entered), and so on. This means that counting Pin BBLs is unlikely to give the count you would expect if you thought that Pin BBLs were the same as the basic blocks in the text book. Here, for instance, if the code branches to .L7 you will count one Pin BBL, but there are four classical basic blocks executed.
Pin also breaks BBLs on some other instructions which may be unexpected, for instance cpuid, popf and REP prefixed instructions all end traces and therefore BBLs. Since REP prefixed instructions are treated as implicit loops, if a REP prefixed instruction iterates more than once, iterations after the first will cause a single instruction BBL to be generated, so in this case you would see more basic blocks executed than you might expect.
As a convenience for Pintool writers, Pin also offers an instruction instrumentation mode which lets the tool inspect and instrument an executable a single instruction at a time. This is essentially identical to trace instrumentation where the Pintool writer has been freed from the responsibilty of iterating over the instructions inside a trace. As decribed under trace instrumentation, certain BBLs and the instructions inside of them may be generated (and hence instrumented) multiple times. Instruction instrumentation utilizes the INS_AddInstrumentFunction API call.
Sometimes, however, it can be useful to look at different granularity than a trace. For this purpose Pin offers two additional modes: image and routine instrumentation. These modes are implemented by "caching" instrumentation requests and hence incur a space overhead, these modes are aslo referred to as ahead-of-time instrumentation.
Image instrumentation lets the Pintool inspect and instrument an entire image, IMG: Image Object, when it is first loaded. A Pintool can walk the sections, SEC: Section Object, of the image, the routines, RTN: Routine Object, of a section, and the instructions, INS of a routine. Instrumentation can be inserted so that it is executed before or after a routine is executed, or before or after an instruction is executed. Image instrumentation utilizes the IMG_AddInstrumentFunction API call. Image instrumentation depends on symbol information to determine routine boundaries hence PIN_InitSymbols must be called before PIN_Init.
Routine instrumentation lets the Pintool inspect and instrument an entire routine when the image it is contained in is first loaded. A Pintool can walk the instructions of a routine. There is not enough information available to break the instructions into BBLs. Instrumentation can be inserted so that it is executed before or after a routine is executed, or before or after an instruction is executed. Routine instrumentation is provided as a convenience for Pintool writers, as an alternative to walking the sections and routines of the image during the Image instrumentation, as described in the previous paragraph.
Routine instrumentation utilizes the RTN_AddInstrumentFunction API call. Instrumentation of routine exits does not work reliably in the presence of tail calls or when return instructions cannot reliably be detected.
Note that in both Image and Routine instrumentation, it is not possible to know whether or not a routine will actually be executed (since these instrumentations are done at image load time). It is possible to walk the instructions only of routines that are executed, in the Trace or Instruction instrumentation routines, by identifying instructions that are the start of routines. See the tool Tests/parse_executed_rtns.cpp.
Managed platforms support
Pin supports all executables including the managed binaries. From Pin point of view managed binary is one more kind of a self-modifying program. There is a way to cause Pin to differentiate the just-in-time compiled code (Jitted code) from all other dynamically generated code and associate Jitted code with appropriate managed functions. To get this functionality, the just-in-time compiler (Jitter) of the running managed platform should support Jit Profiling API
The following capabilities are supported:
- RTN_IsDynamic() API is used to indentify dynamically created code. A routine can be marked as dynamically created using Jit Profiling API only.
- A Pintool can instrument Jitted routines using RTN_AddInstrumentFunction API See the examples Managed platforms support for more information.
Following conditions must be satisfied to get the managed platforms support:
-
Set LD_LIBRARY_PATH environment variables to include pinjitprofiling dynamic library and Pin CRT libraries location.
-
Add the knob support_jit_api to the Pin command line as Pintool option:
<Pin executable> <Pin options> -t <Pintool> -support_jit_api <Other Pintool options> -- <Test application> <Test application options>
Symbols
Pin provides access to function names using the symbol object (SYM). Symbol objects only provide information about the function symbols in the application. Information about other types of symbols (e.g. data symbols), must be obtained independently by the tool.
On Windows, you can use dbghelp.dll for this.
Note that using dbghelp.dll in an instrumented process is not safe and can cause dead-locks in some cases. A possible solution is to find symbols using a different non-instrumented process.
On Linux, you can use libdwarf.so that is provided as part of the Pin kit to access DWARF information.
libdwarf
The libdwarf.so library in the Pin kit is based on the open source libdwarf project (https://www.prevanders.net/dwarf.html) and is linked with Pin CRT.
The libdwarf header files are located at ./extras/libdwarf/libdwarf-0.7.0/src/lib/libdwarf under the Pin root directory.
The libdwarf.so libraries are located together with the other Pin libraries at intel64/lib/ and ia32/lib/.
To use the library, add the libdwarf include directory to the pintool include path, and link with libdwarf.so (add -ldwarf to the link command).
The full documentatino of the libdwarf API can be found in the open source libdwarf project page https://www.prevanders.net/libdwarfdoc/index.html
The repository includes examples for how to use the API, for example the dwarfdump application and several examples under dwarfexample.
The Pin kit includes one pintool that uses the libdwarf library - DebugInfo/libdwarf_client.cpp
The Pin kit includes, in addition to the libdwarf.so library, the sources that were used to build it.
The sources are provided at ./extras/libdwarf under the Pin root directory.
The README file includes instructions on how to build the library from those sources.
PIN_InitSymbols must be called to access functions by name. See Symbols for more information.
Floating Point Support in Analysis Routines
Pin takes care of maintaining the application's floating point state accross analysis routines.
IARG_REG_VALUE cannot be used to pass floating point register values as arguments to analysis routines.
Instrumenting Multi-threaded Applications
Instrumenting a multi-threaded program requires that the tool be thread safe - access to global storage must be coordinated with other threads. Pin tries to provide a conventional C++ program environment for tools, but it is not possible to use the standard library interfaces to manage threads in a Pintool. For example, Linux tools cannot use the pthreads library and Windows tools should not use the Win32 API's to manage threads. Instead, Pin provides its own locking and thread management API's, which the Pintool should use. (See LOCK: Locking Primitives and Pin Thread API.)
Pintools do not need to add explicit locking to instrumentation routines because Pin calls these routines while holding an internal lock called the VM lock. However, Pin does execute analysis and replacement functions in parallel, so Pintools may need to add locking to these routines if they access global data.
Pintools on Linux also need to take care when calling standard C or C++ library routines from analysis or replacement functions because the C and C++ libraries linked into Pintools are not thread-safe. Some simple C / C++ routines are safe to call without locking, because their implementations are inherently thread-safe, however, Pin does not attempt to provide a list of safe routines. If you are in doubt, you should add locking around calls to library functions. In particular, the "errno" value is not multi-thread safe, so tools that use this should provide their own locking. Note that these restrictions only exist on the Unix platforms, as the library routines on Windows are thread safe.
Pin provides call-backs when each thread starts and ends (see PIN_AddThreadStartFunction and PIN_AddThreadFiniFunction). These provide a convenient place for a Pintool to allocate and manipulate thread local data and store it on a thread's local storage.
Pin also provides an analysis routine argument (IARG_THREAD_ID), which passes a Pin-specific thread ID for the calling thread. This ID is different from the O/S system thread ID, and is a small number starting at 0, which can be used as an index to an array of thread data or as the locking value to Pin user locks. See the example Instrumenting Threaded Applications for more information.
In addition to the Pin thread ID, the Pin API provides an efficient thread local storage (TLS), with the option to allocate a new TLS key and associate it with a given data destruction function. Any thread of the process can store and retrieve values in its own slot, referenced by the allocated key. The initial value associated with the key in all threads is NULL. See the example Using TLS for more information.
False sharing occurs when multiple threads access different parts of the same cache line and at least one of them is a write. To maintain memory coherency, the computer must copy the memory from one CPU's cache to another, even though data is not truly shared. False sharing can usually be avoided by padding critical data structures to the size of a cache line, or by rearranging the data layout of structures. See the example Using TLS for more information.
Avoiding Deadlocks in Multi-threaded Applications
Since Pin, the tool, and the application may each acquire and release locks, Pintool developers must take care to avoid deadlocks with either the application or Pin. Deadlocks generally occur when two threads acquire the same locks in a different order. For example, thread A acquires lock L1 and then acquires lock L2, while thread B acquires lock L2 and then acquires lock L1. This will lead to a deadlock if thread A holds lock L1 and waits for L2 while thread B holds lock L2 and waits for L1. To avoid such deadlocks, Pin imposes a hierarchy on the order in which locks must be acquired. Pin generally acquires its own internal locks before the tool acquires any lock (e.g. via PIN_GetLock()). Additionally, we assume that the application may acquire locks at the top of this hierarchy (i.e. before Pin acquires its internal locks). The following diagram illustrates the hierarchy:
Application locks -> Pin internal locks -> Tool locks
Pintool developers should design their Pintools such that they never break this lock hierarchy, and they can do so by following these basic guidelines:
- If the tool acquires any locks from within a Pin call-back, it must release those locks before returning from that call-back. Holding a lock across Pin call-backs violates the hierarchy with respect to the Pin internal locks.
- If the tool acquires any locks from within an analysis routine, it must release those locks before returning from the analysis routine. Holding a lock across Pin analysis routines violates the hierarchy with respect to Pin internal locks and other locks used by the instrumented application itself.
- If the tool calls a Pin API from within a Pin call-back or analysis routine, it should not hold any tool locks when calling the API. Some of the Pin APIs use the internal Pin locks so holding a tool lock before invoking these APIs violates the hierarchy with respect to the Pin internal locks.
- If the tool calls a Pin API from within an analysis routine, it may need to acquire the Pin client lock first by calling PIN_LockClient(). This depends on the API, so check the documentation for the specific API for more information. Note that the tool should not hold any other locks when calling PIN_LockClient(), as described in the previous item.
While these guidelines are sufficient in most cases, they may turn out to be too restrictive for certain use-cases. The next set of guidelines explains the conditions in which it is safe to relax the basic guidelines above:
- In JIT mode, the tool may acquire locks from within an analysis routine and not release them, providing it releases these locks before leaving the trace that contains the analysis routine. The tool must expect that the trace may exit "early" if an application instruction raises an exception. Any lock
L, which the tool might hold when the application raises an exception, must obey the following sub-rules:- The tool must establish a call-back that executes when the application raises an exception and this call-back must release lock
Lif it was acquired at the time the exception occurred. Tools can use PIN_AddContextChangeFunction() to establish this call-back. - The tool must not acquire lock
Lfrom within any Pin call-back, to avoid violating the hierarchy with respect to the Pin internal locks.
- The tool must establish a call-back that executes when the application raises an exception and this call-back must release lock
- If the tool calls a Pin API from an analysis routine, it may acquire and hold a lock
Lwhile calling the API providing that:- Lock
Lis not being acquired from any Pin call-back. This avoids the hierarchy violation with respect to the Pin internal locks. - The Pin API being invoked does not cause application code to execute (e.g., PIN_CallApplicationFunction()). This avoids the hierarchy violation with respect to the locks used by the application itself.
- Lock
Examples
Table of Contents
- Building the Example Tools
- Notes for Building Tools for Windows
- Simple Instruction Count (Instruction Instrumentation)
- Instruction Address Trace (Instruction Instrumentation)
- Memory Reference Trace (Instruction Instrumentation)
- Detecting the Loading and Unloading of Images (Image Instrumentation)
- More Efficient Instruction Counting (Trace Instrumentation)
- Procedure Instruction Count (Routine Instrumentation)
- Using PIN_SafeCopy()
- Order of Instrumentation
- Finding the Value of Function Arguments
- Finding Functions By Name on Windows
- Instrumenting Threaded Applications
- Using TLS
- Using the Fast Buffering APIs
- Finding the Static Properties of an Image
- Detaching Pin from the Application
- Replacing a Routine in Probe Mode
- Instrumenting Child Processes
- Instrumenting Before and After Forks
- Managed platforms support
To illustrate how to write Pintools, we present some simple examples. In the web based version of the manual, you can click on a function in the Pin API to see its documentation.
All the examples presented in the manual can be found in the source/tools/ManualExamples directory.
Building the Example Tools
To build all examples in a directory for ia32 architecture:
$ cd source/tools/ManualExamples
$ make all TARGET=ia32
To build all examples in a directory for intel64 architecture:
$ cd source/tools/ManualExamples
$ make all TARGET=intel64
To build and run a specific example (e.g., inscount0):
$ cd source/tools/ManualExamples
$ make inscount0.test TARGET=intel64
To build a specific example without running it (e.g., inscount0):
$ cd source/tools/ManualExamples
$ make obj-intel64/inscount0.so TARGET=intel64
The above applies to the Intel(R) 64 architecture. For the IA-32 architecture, use TARGET=ia32 instead.
$ cd source/tools/ManualExamples
$ make obj-ia32/inscount0.so TARGET=ia32
Notes for Building Tools for Windows
Since the tools are built using make, be sure to install cygwin make first.
Open the Visual Studio Command Prompt corresponding to your target architecture, i.e. x86 or x64, and follow the steps in the Building the Example Tools section.
Simple Instruction Count (Instruction Instrumentation)
The example below instruments a program to count the total number of instructions executed. It inserts a call to docount before every instruction. When the program exits, it saves the count in the file inscount.out.
Here is how to run it and display its output (note that the file list is the ls output, so it may be different on your machine, similarly the instruction count will depend on the implementation of ls):
$ ../../../pin -t obj-intel64/inscount0.so -- /bin/ls
Makefile          atrace.o     imageload.out  itrace      proccount
Makefile.example  imageload    inscount0      itrace.o    proccount.o
atrace            imageload.o  inscount0.o    itrace.out
$ cat inscount.out
Count 422838
$
The KNOB exhibited in the example below overwrites the default name for the output file. To use this feature, add "-o <file_name>" to the command line. Tool command line options should be inserted between the tool name and the double dash ("--"). For more information on how to add command line options to your tool, please see KNOB: Commandline Option Handling.
$ ../../../pin -t obj-intel64/inscount0.so -o inscount0.log -- /bin/ls
The example can be found in source/tools/ManualExamples/inscount0.cpp
Instruction Address Trace (Instruction Instrumentation)
In the previous example, we did not pass any arguments to docount, the analysis procedure. In this example, we show how to pass arguments. When calling an analysis procedure, Pin allows you to pass the instruction pointer, current value of registers, effective address of memory operations, constants, etc. For a complete list, see IARG_TYPE.
With a small change, we can turn the instruction counting example into a Pintool that prints the address of every instruction that is executed. This tool is useful for understanding the control flow of a program for debugging, or in processor design when simulating an instruction cache.
We change the arguments to INS_InsertCall to pass the address of the instruction about to be executed. We replace docount with printip, which prints the instruction address. It writes its output to the file itrace.out.
This is how to run it and look at the output:
$ ../../../pin -t obj-intel64/itrace.so -- /bin/ls
Makefile          atrace.o     imageload.out  itrace      proccount
Makefile.example  imageload    inscount0      itrace.o    proccount.o
atrace            imageload.o  inscount0.o    itrace.out
$ head itrace.out
0x40001e90
0x40001e91
0x40001ee4
0x40001ee5
0x40001ee7
0x40001ee8
0x40001ee9
0x40001eea
0x40001ef0
0x40001ee0
$
The example can be found in source/tools/ManualExamples/itrace.cpp
Memory Reference Trace (Instruction Instrumentation)
The previous example instruments all instructions. Sometimes a tool may only want to instrument a class of instructions, like memory operations or branch instructions. A tool can do this by using the Pin API which includes functions that classify and examine instructions. The basic API is common to all instruction sets and is described here. In addition, there is an instruction set specific API for the IA-32 ISA.
In this example, we show how to do more selective instrumentation by examining the instructions. This tool generates a trace of all memory addresses referenced by a program. This is also useful for debugging and for simulating a data cache in a processor.
We only instrument instructions that read or write memory. We also use INS_InsertPredicatedCall instead of INS_InsertCall to avoid generating references to instructions that are predicated when the predicate is false. On IA-32 and Intel(R) 64 architectures CMOVcc, FCMOVcc and REP prefixed string operations are treated as being predicated. For CMOVcc and FCMOVcc the predicate is the condition test implied by "cc", for REP prefixed string ops it is that the count register is non-zero.
Since the instrumentation functions are only called once and the analysis functions are called every time an instruction is executed, it is much faster to instrument only the memory operations, as compared to the previous instruction trace example that instruments every instruction.
Here is how to run it and the sample output:
$ ../../../pin -t obj-intel64/pinatrace.so -- /bin/ls
Makefile          atrace.o    imageload.o    inscount0.o  itrace.out
Makefile.example  atrace.out  imageload.out  itrace       proccount
atrace            imageload   inscount0      itrace.o     proccount.o
$ head pinatrace.out
0x40001ee0: R 0xbfffe798
0x40001efd: W 0xbfffe7d4
0x40001f09: W 0xbfffe7d8
0x40001f20: W 0xbfffe864
0x40001f20: W 0xbfffe868
0x40001f20: W 0xbfffe86c
0x40001f20: W 0xbfffe870
0x40001f20: W 0xbfffe874
0x40001f20: W 0xbfffe878
0x40001f20: W 0xbfffe87c
$
The example can be found in source/tools/ManualExamples/pinatrace.cpp
Detecting the Loading and Unloading of Images (Image Instrumentation)
The example below prints a message to a trace file every time and image is loaded or unloaded. It really abuses the image instrumentation mode as the Pintool neither inspects the image nor adds instrumentation code.
If you invoke it on ls, you would see this output:
$ ../../../pin -t obj-intel64/imageload.so -- /bin/ls
Makefile          atrace.o    imageload.o    inscount0.o  proccount
Makefile.example  atrace.out  imageload.out  itrace       proccount.o
atrace            imageload   inscount0      itrace.o     trace.out
$ cat imageload.out
Loading /bin/ls
Loading /lib/ld-linux.so.2
Loading /lib/libtermcap.so.2
Loading /lib/i686/libc.so.6
Unloading /bin/ls
Unloading /lib/ld-linux.so.2
Unloading /lib/libtermcap.so.2
Unloading /lib/i686/libc.so.6
$
The example can be found in source/tools/ManualExamples/imageload.cpp
More Efficient Instruction Counting (Trace Instrumentation)
The example Simple Instruction Count (Instruction Instrumentation) computed the number of executed instructions by inserting a call before every instruction. In this example, we make it more efficient by counting the number of instructions in a BBL: Single entrance, single exit sequence of instructions at instrumentation time, and incrementing the counter once per BBL: Single entrance, single exit sequence of instructions, instead of once per instruction.
The example can be found in source/tools/ManualExamples/inscount1.cpp
Procedure Instruction Count (Routine Instrumentation)
The example below instruments a program to count the number of times a procedure is called, and the total number of instructions executed in each procedure. When it finishes, it prints a profile to proccount.out
Executing the tool and sample output:
$ ../../../pin -t obj-intel64/proccount.so -- /bin/grep proccount.cpp Makefile
proccount_SOURCES = proccount.cpp
$ head proccount.out
              Procedure           Image            Address        Calls Instructions
                  _fini       libc.so.6         0x40144d00            1           21
__deregister_frame_info       libc.so.6         0x40143f60            2           70
  __register_frame_info       libc.so.6         0x40143df0            2           62
              fde_merge       libc.so.6         0x40143870            0            8
            __init_misc       libc.so.6         0x40115824            1           85
            __getclktck       libc.so.6         0x401157f4            0            2
                 munmap       libc.so.6         0x40112ca0            1            9
                   mmap       libc.so.6         0x40112bb0            1           23
            getpagesize       libc.so.6         0x4010f934            2           26
$
The example can be found in source/tools/ManualExamples/proccount.cpp
Using PIN_SafeCopy()
PIN_SafeCopy is used to copy the specified number of bytes from a source memory region to a destination memory region. This function guarantees safe return to the caller even if the source or destination regions are inaccessible (entirely or partially).
Use of this function also guarantees that the tool reads or writes the values used by the application. For example, on Windows, Pin replaces certain TEB fields when running a tool's analysis code. If the tool accessed these fields directly, it would see the modified values rather than the original ones. Using PIN_SafeCopy() allows the tool to read or write the application's values for these fields.
We recommend using this API any time a tool reads or writes application memory.
$ ../../../pin -t obj-ia32/safecopy.so -- /bin/cp makefile obj-ia32/safecopy.so.makefile.copy
$ head safecopy.out
Emulate loading from addr 0xbff0057c to ebx
Emulate loading from addr 0x64ffd4 to eax
Emulate loading from addr 0xbff00598 to esi
Emulate loading from addr 0x6501c8 to edi
Emulate loading from addr 0x64ff14 to edx
Emulate loading from addr 0x64ff1c to edx
Emulate loading from addr 0x64ff24 to edx
Emulate loading from addr 0x64ff2c to edx
Emulate loading from addr 0x64ff34 to edx
Emulate loading from addr 0x64ff3c to edx
The example can be found in source/tools/ManualExamples/safecopy.cpp.
Order of Instrumentation
Pin provides tools with multiple ways to control the exection order of analysis calls. The exection order depends mainly on the insertion action (IPOINT) and call order (CALL_ORDER). The example below illustrates this behavior by instrumenting all return instructions in three different ways. Additional examples can be found in source/tools/InstrumentationOrderAndVersion.
$ ../../../pin -t obj-ia32/invocation.so -- obj-ia32/little_malloc
$ head invocation.out
After: IP = 0x64bc5e
Before: IP = 0x64bc5e
Taken: IP = 0x63a12e
After: IP = 0x64bc5e
Before: IP = 0x64bc5e
Taken: IP = 0x641c76
After: IP = 0x641ca6
After: IP = 0x64bc5e
Before: IP = 0x64bc5e
Taken: IP = 0x648b02
The example can be found in source/tools/ManualExamples/invocation.cpp.
Finding the Value of Function Arguments
Often one needs the know the value of the argument passed into a function, or the return value. You can use Pin to find this information. Using the RTN_InsertCall() function, you can specify the arguments of interest.
The example below prints the input argument for malloc() and free(), and the return value from malloc().
$ ../../../pin -t obj-ia32/malloctrace.so -- /bin/cp makefile obj-ia32/malloctrace.so.makefile.copy
$ head malloctrace.out
malloc(0x24d)
  returns 0x6504f8
malloc(0x57)
  returns 0x650748
malloc(0xc)
  returns 0x6507a0
malloc(0x3c0)
  returns 0x6507b0
malloc(0xc)
  returns 0x650b70
The example can be found in source/tools/ManualExamples/malloctrace.cpp.
Finding Functions By Name on Windows
Finding functions by name on Windows requires a different methodology. Several symbols could resolve to the same function address. It is important to check all symbol names.
The following example finds the function name in the symbol table, and uses the symbol address to find the appropriate RTN.
$ ..\..\..\pin -t obj-ia32\w_malloctrace.dll -- ..\Tests\obj-ia32\cp-pin.exe makefile w_malloctrace.makefile.copy
$ head *.out
Before: RtlAllocateHeap(00150000, 0, 0x94)
After: RtlAllocateHeap  returns 0x153440
After: RtlAllocateHeap  returns 0x153440
Before: RtlAllocateHeap(00150000, 0, 0x20)
After: RtlAllocateHeap  returns 0
After: RtlAllocateHeap  returns 0x1567c0
Before: RtlAllocateHeap(019E0000, 0x8, 0x1800)
After: RtlAllocateHeap  returns 0x19e0688
Before: RtlAllocateHeap(00150000, 0, 0x1a)thread begin 0

After: RtlAllocateHeap  returns 0
The example can be found in source/tools/ManualExamples/w_malloctrace.cpp.
Instrumenting Threaded Applications
The following example demonstrates using the ThreadStart() and ThreadFini() notification callbacks. Although ThreadStart() and ThreadFini() are executed under the VM and client locks, they could still contend with resources that are shared by other analysis routines. Using PIN_GetLock() prevents this.
Note that there is known isolation issue when using Pin on Windows. On Windows, a deadlock can occur if a tool opens a file in a callback when run on a multi-threaded application. To work around this problem, open one file in main, and tag the data with the thread ID. See source/tools/ManualExamples/buffer_windows.cpp as an example. This problem does not exist on Linux.
$ ../../../pin -t obj-ia32/malloc_mt.so -- obj-ia32/thread_lin
$ head malloc_mt.out
thread begin 0
thread 0 entered malloc(24d)
thread 0 entered malloc(57)
thread 0 entered malloc(c)
thread 0 entered malloc(3c0)
thread 0 entered malloc(c)
thread 0 entered malloc(58)
thread 0 entered malloc(56)
thread 0 entered malloc(19)
thread 0 entered malloc(25c)
The example can be found in source/tools/ManualExamples/malloc_mt.cpp
Using TLS
Pin provides efficient thread local storage (TLS) APIs. These APIs allow a tool to create thread-specific data. The example below demonstrates how to use these APIs.
$ ../../../pin -t obj-ia32/inscount_tls.so -- obj-ia32/thread_lin
$ head
Count[0]= 237993
Count[1]= 213296
Count[2]= 209223
Count[3]= 209223
Count[4]= 209223
Count[5]= 209223
Count[6]= 209223
Count[7]= 209223
Count[8]= 209223
Count[9]= 209223
The example can be found in source/tools/ManualExamples/inscount_tls.cpp
Using the Fast Buffering APIs
Pin provides support for buffering data for processing. If all that your analysis callback does is to store its arguments into a buffer, then you should be able to use the buffering API instead, with some performance benefit. PIN_DefineTraceBuffer() defines the buffer that will be used. The buffer is allocated by each thread when it starts up, and deallocated when the thread exits. INS_InsertFillBuffer() writes the requested data directly to the given buffer. The callback delineated in the PIN_DefineTraceBuffer() call is used to process the buffer when the buffer is nearly full, and when the thread exits. Pin does not serialize the calls to this callback, so it is the tool writers responsibilty to make sure this function is thread safe. This example records the PC of all instructions that access memory, and the effective address accessed by the instruction. Note that IARG_REG_REFERENCE, IARG_REG_CONST_REFERENCE, IARG_CONTEXT, IARG_CONST_CONTEXT and IARG_PARTIAL_CONTEXT can NOT be used in the Fast Buffering APIs
$ ../../../pin -t obj-ia32/buffer_linux.so -- obj-ia32/thread_lin
$ tail buffer.out.*.*
3263df   330108
3263df   330108
3263f1   a92f43fc
3263f7   a92f4d7d
326404   a92f43fc
32640a   a92f4bf8
32640a   a92f4bf8
32640f   a92f4d94
32641b   a92f43fc
326421   a92f4bf8
The example can be found in source/tools/ManualExamples/buffer_linux.cpp. This example is appropriate for Linux tools. If you are writing a tool for Windows, please see source/tools/ManualExamples/buffer_windows.cpp
Finding the Static Properties of an Image
It is also possible to use Pin to examine binaries without instrumenting them. This is useful when you need to know static properties of an image. The sample tool below counts the number of instructions in an image, but does not insert any instrumentation.
The example can be found in source/tools/ManualExamples/staticcount.cpp
Detaching Pin from the Application
Pin can relinquish control of application any time when invoked via PIN_Detach. Control is returned to the original uninstrumented code and the application runs at native speed. Thereafter no instrumented code is ever executed.
The example can be found in source/tools/ManualExamples/detach.cpp
Replacing a Routine in Probe Mode
Probe mode is a method of using Pin to insert probes at the start of specified routines. A probe is a jump instruction that is placed at the start of the specified routine. The probe redirects the flow of control to the replacement function. Before the probe is inserted, the first few instructions of the specified routine are relocated. It is not uncommon for the replacement function to call the replaced routine. Pin provides the relocated address to facilitate this. See the example below.
In probe mode, the application and the replacement routine are run natively. This improves performance, but it puts more responsibility on the tool writer. Probes can only be placed on RTN boundaries.
Many of the PIN APIs that are available in JIT mode are not applicable in Probe mode. In particular, the Pin thread APIs are not supported in Probe mode, because Pin has no information about the threads when the application is run natively. For more information, check the RTN API documentation.
The tool writer must guarantee that there is no jump target where the probe is placed. A probe may be up to 14 bytes long.
Also, it is the tool writer's responsibility to ensure that no thread is currently executing the code where a probe is inserted. Tool writers are encouraged to insert probes when an image is loaded to avoid this problem. Pin will automatically remove the probes when an image is unloaded.
When using probes, Pin must be started with the PIN_StartProgramProbed() API.
The example can be found in source/tools/ManualExamples/replacesigprobed.cpp. To build this test, execute:
$ make replacesigprobed.test
Instrumenting Child Processes
The PIN_AddFollowChildProcessFunction() allows you to define the function you will like to execute before an execv'd process starts. Use the -follow_execv option on the command line to instrument the child processes, like this:
$ ../../../pin -follow_execv -t obj-intel64/follow_child_tool.so -- obj-intel64/follow_child_app1 obj-intel64/follow_child_app2
The example can be found in source/tools/ManualExamples/follow_child_tool.cpp. To build this test, execute:
$ make follow_child_tool.test
Instrumenting Before and After Forks
Pin allows Pintools to register for notification callbacks around forks. The PIN_AddForkFunction() and PIN_AddForkFunctionProbed() callbacks allow you to define the function you want to execute at one of these FPOINTs:
    FPOINT_BEFORE            Call-back in parent, just before fork.
    FPOINT_AFTER_IN_PARENT   Call-back in parent, immediately after fork.
    FPOINT_AFTER_IN_CHILD    Call-back in child, immediately after fork.
Note that PIN_AddForkFunction() is used for JIT mode and PIN_AddForkFunctionProbed() is used for Probed mode. If the fork() fails, the FPOINT_AFTER_IN_PARENT callback, if it is defined, will execute anyway.
The example can be found in source/tools/ManualExamples/fork_jit_tool.cpp. To build this test, execute:
$ make fork_jit_tool.test
Managed platforms support
Pin allows Pintools to indentify dynamically created code using RTN_IsDynamic() API (only code of functions which are reported by Jit Profiling API). The following example demonstrates use of RTN_IsDynamic() API. This example instruments a program to count the total number of instructions discovered and executed. The instructions are divided to three categories: native instructions, dynamic instructions and instructions without any known routine.
Here is how to run it and display its output with a 32 bit OpenCL sample on Windows:
$ set CL_CONFIG_USE_VTUNE=True
$ set INTEL_JIT_PROFILER32=ia32\bin\pinjitprofiling.dll
$ ia32\bin\pin.exe -t source\tools\JitProfilingApiTests\obj-ia32\DynamicInsCount.dll -support_jit_api -o DynamicInsCount.out -- ..\OpenCL\Win32\Debug\BitonicSort.exe
No command line arguments specified, using default values.
Initializing OpenCL runtime...
Trying to run on a CPU
OpenCL data alignment is 128 bytes.
Reading file 'BitonicSort.cl' (size 3435 bytes)
Sort order is ascending
Input size is 1048576 items
Executing OpenCL kernel...
Executing reference...
Performing verification...
Verification succeeded.
NDRange perf. counter time 12994.272962 ms.
Releasing resources...
$ type JitInsCount.out
===============================================
Number of executed native instructions: 7631596649
Number of executed jitted instructions: 438983207
Number of executed instructions without any known routine: 12246
===============================================
Number of discovered native instructions: 870531
Number of discovered jitted instructions: 223
Number of discovered instructions without any known routine: 36
===============================================

$
The example can be found in source\tools\JitProfilingApiTests\DynamicInsCount.cpp
Pin allows Pintools to instrument just compiled functions using RTN_AddInstrumentFunction API. Following example instruments a program to log Jitting and running of dynamic functions which are reported by Jit Profiling API.
Here is how to run it with a 64 bit OpenCL sample on Linux:
$ setenv CL_CONFIG_USE_VTUNE True
$ setenv INTEL_JIT_PROFILER64 intel64/lib/libpinjitprofiling.so
$ ./pin -t source/tools/JitProfilingApiTests/obj-intel64/DynamicFuncInstrument.so -support_jit_api -o DynamicFuncInstrument.out -- ..\OpenCL\Win32\Debug\BitonicSort.exe
No command line arguments specified, using default values.
Initializing OpenCL runtime...
Trying to run on a CPU
OpenCL data alignment is 128 bytes.
Reading file 'BitonicSort.cl' (size 3435 bytes)
Sort order is ascending
Input size is 1048576 items
Executing OpenCL kernel...
Executing reference...
Performing verification...
Verification succeeded.
NDRange perf. counter time 12994.272962 ms.
Releasing resources...
$
The example can be found in source\tools\JitProfilingApiTests\DynamicFuncInstrument.cpp
Callbacks
The examples in the previous section have introduced a number of ways to register callback functions via the Pin API, such as:
- INS_AddInstrumentFunction (INSCALLBACK fun, VOID *val)
- TRACE_AddInstrumentFunction (TRACECALLBACK fun, VOID *val)
- RTN_AddInstrumentFunction (RTNCALLBACK fun, VOID *val)
- IMG_AddInstrumentFunction (IMGCALLBACK fun, VOID *val)
- PIN_AddFiniFunction (FINICALLBACK fun, VOID *val)
- PIN_AddDetachFunction (DETACHCALLBACK fun, VOID *val)
The extra parameter val (shared by all the registration functions) will be passed to fun as its second argument whenever it is "called back". This is a standard mechanism used in GUI programming with callbacks.
If this feature is not needed, it is safe to pass 0 for val when registering a callback. The expected use of val is to pass a pointer to an instance of a class. Since val is a generic pointer, fun must cast it back to an object before dereferencing the pointer.
Note that all callback registration functions return a PIN_CALLBACK object which can later be used to manipulate the properties of the registered callback (for example change the order in which PIN executes callback functions of the same type). This can be done by calling API functions that manipulates the PIN_CALLBACK object (see PIN callbacks)
Modifying Application Instructions
Although Pin is most commonly used for instrumenting applications, it is also possible to change the application's instructions. The simplest way to do this is to insert an analysis routine to emulate an instruction, and then use INS_Delete() to remove the original instruction. It is also possible to insert direct or indirect branches (using INS_InsertDirectJump and INS_InsertIndirectJump), which makes it easier to emulate instructions that change the control flow.
The memory addresses accessed by an instruction can be modified to refer to a value calculated by an analysis routine using INS_RewriteMemoryOperand.
For instructions whose memory operand has scattered access (vscatter/vgather), use INS_RewriteScatteredMemoryOperand.
Note that in all of the cases where an instruction is modified, the modification is only made after all of the instrumentation routines have been executed. Therefore all of the instrumentation routines see the original, un-modified instruction.
Instrumenting multi element instruction operands
Multi Element operands are operands of vector instructions and tile instructions, where the operand is a vector/matrix of elements and the instruction operation is performed on each element separately. For example, instructions from the SSE, AVX, AVX2, AVX512, AMX extensions, etc.
Pin supports the inspection and instrumentation of the operand elements.
For examples specific to AMX see Instrumenting AMX instructions
The following functions allow inspecting the static attributes of multi element operands:
INS_OperandElementSize
INS_OperandElementCount
INS_MemoryOperandElementSize
INS_MemoryOperandElementCount
INS_OperandHasElements
The following IARGs and interfaces allow inspecting static and runtime attributes of multi element operands:
IARG_MULTI_ELEMENT_OPERAND
IMULTI_ELEMENT_OPERAND
The code below demonstrates how to instrument memory operands and pass the effective address of the operand or operand elements to the analysis routine.
When to use IARG_MULTI_ELEMENT_OPERAND
The IMULTI_ELEMENT_OPERAND interface is applicable for all the vector instructions which operands have elements.
Some of the operand attributes covered by IMULTI_ELEMENT_OPERAND are known at instrumentation time, for example the number of elements and the size of an element.
The attributes that are only known during runtime are the effective addresses and mask values.
For some usages, IARG_MULTI_ELEMENT_OPERAND has alternatives which are discussed in sub-sections below.
Note that typically IARG_MULTI_ELEMENT_OPERAND would be slower than those alternatives.
Reading effective addresses
For reading effective addresses, IARG_MULTI_ELEMENT_OPERAND is recommended for instruction where the memory operand addresses non-contiogous memory
(where INS_HasScatteredMemoryAccess returns TRUE), for example vscatter/vgather.
The other option is calculating the addresses manually by passing the value of the index register, base, scale, etc.
For other vector instruction that don't fall into that category, the alternative to using IARG_MULTI_ELEMENT_OPERAND would be using IARG_MEMORYOP_EA and read the elements manually.
The code below demonstrates how to read effective addresses both ways.
Reading mask values
For reading mask values, an alternative to IARG_MULTI_ELEMENT_OPERAND would be using IARG_REG_CONST_REFERENCE and extract the mask values manually.
When extracted manually, the pintool must know where the mask bit is located in the mask register.
The code below demonstrates how to read mask values both ways.
Instrumenting AMX instructions
This section describes how to read the AMX state, tile configuration and how to instrument the AMX instruction operands, either Memory or TMM registers.
PIN_IsAmxActive returns the current AMX state.
Since instrumentation and analysis happen on different phases in the application flow, it is necessary to check the current AMX state in the analysis routine before analyzing the rest of the data in order to know whether this data is valid or not.
The following functions allow inspecting the dimensions of the matrix:
TileCfg_GetTileBytesPerRow
TileCfg_GetTileRows
These functions get a virtual register that reflects the tiles configuration ( REG_TILECONFIG ) and a TMM register for which the dimensions should be retrieved.
In order to use these functions in an analysis routine we must first inspect the instruction operands to identify the relevant TMM register, as shown in the example below.
AMX and Multi Elements
AMX tiles are multi element operands.
The difference between AMX tile operands and non-AMX multi element operands is that the number of elements is not known until after the LDTILECFG instruction executes, while for the non-AMX operands the number of elements is a static attribute of the instruction.
This means that APIs such as INS_OperandElementCount or INS_MemoryOperandElementCount will return 0 for AMX operands.
Reading a Memory tile content at analysis time requires using IARG_MULTI_ELEMENT_OPERAND that provides the IMULTI_ELEMENT_OPERAND interface through which the matrix cells addresses can be retrieved.
Reading a TMM register content at analysis time requires using both IARG_REG_REFERENCE / IARG_REG_CONST_REFERENCE that provide the full content of the tile,
and IARG_MULTI_ELEMENT_OPERAND that provides the IMULTI_ELEMENT_OPERAND interface through which the cells offsets within the tile can be retrieved.
Below is code example for the instrumentation callback where we configure the instrumentation.
In this example we instrument TILELOADD and TILESTORED and create an instrumentation that will allow us to read the runtime values of the memory matrix and the tile register matrix.
Below is code example for the analysis routine where we analyze the runtime values of the operands previously configured. In this example we print the cell values of the memory matrix and the tile register matrix.
Instrumenting IFUNC functions in Linux
GNU indirect function (IFUNC) is a feature that allows a developer to create multiple implementations of a given function and to select amongst them at runtime using a resolver function. It is mainly used in glibc. (e.g. memcpy/memset/strcpy)
Pin supports instrumentation on both IFUNC-resolver functions and their implementation/actual function.
Note: instrumentation on the ifunc function is the same as instrumentation on the resolver function and vice versa (since ifunc symbol value is the address of the resolver).
In order to instrument IFUNC function, PIN_InitSymbolsAlt(IFUNC_SYMBOLS) must be called in Pintool main function. Otherwise, IFUNC functions will not be visible in Pintool, only implementation functions (e.g. for memcmp: __memcmp_sse2, __memcmp_ssse3,... )
Usages in Pintool:
- To check if a given rtn is an ifunc function use: Bool isResolver = SYM_IFuncResolver(RTN_Sym(rtn));
- To get the implementation/actual function use: RTN impl = RTN_IFuncImplementation(rtn);
See first example below demonstrating this usage. - RTN_FindByName() returns the implementation/actual function when IFUNC function name is passed as an argument.
To get the resolver use: RTN resolver = RTN_IFuncResolver(rtn), where rtn is the implementation/actual function.
See second example below demonstrating this usage.
The following example demonstrates instrumenting both IFUNC implementation and resolver using RTN_Name(), SYM_IFuncResolver() and RTN_IFuncImplementation():
The following example demonstrates instrumenting both IFUNC implementation and resolver using RTN_FindByName():
The Pin Advanced Debugging Extensions
Pin's advanced debugging extensions allow you to debug an application, even while it runs under Pin in JIT mode. Moreover, your Pintool can add support for new debugger commands, without making any changes to GDB, LLDB or Visual Studio. This allows you to interactively control your Pintool from within a live debugger session. Finally, Pintools can add powerful new debugger features that are enabled via instrumentation. For example, a Pintool can use instrumentation to look for an interesting condition (like a memory buffer overwrite) and then stop at a live debugger session when that condition occurs.
This section illustrates these three concepts:
- Enabling all the traditional debugger features even while running an application under Pin in JIT mode.
- Recognizing new debugger commands in your Pintool to allow interactive control of the tool from a live debugger session.
- Adding support for new debugger features by writing a Pintool.
These features are available on Linux (using GDB) and Windows (using Visual Studio). The Pin APIs are the same in all cases, but their usage from within the debugger may differ because each debugger has a different UI. The following tutorial is divided into two sections: one that is Linux centric and another that is Windows centric. They both describe the same example, so you can continue by reading either section.
Finally, note that these advanced debugging extensions are not at all related to debugging your Pintool. If you have a bug in your tool and need to debug it, see the section Tips for Debugging a Pintool instead.
Advanced Debugging Extensions on Linux
Pin's debugging extensions on Linux work with nearly all modern versions of GDB/LLDB, so you can probably use whatever version of GDB/LLDB is already installed on your system. Pin uses GDB's remote debugger features, so it should work with any version of GDB/LLDB that supports that feature (Yes, LLDB support GDB's remote debugger features).
Throughout this section, we demonstrate the debugging extensions in Pin with the example tool "stack-debugger.cpp", which is available in the directory "source/tools/ManualExamples". You may want to compile that tool and follow along:
$ cd source/tools/ManualExamples
$ make DEBUG=1 stack-debugger.test
The tool and its associated test application, "fibonacci", are built in a directory named "obj-ia32", "obj-intel64", etc., depending on your machine type.
To enable the debugging extensions, run Pin with the -appdebug command line switch. This causes Pin to start the application and stop immediately before the first instruction. Pin then prints a message telling you to start debugger.
Linux:
$ ../../../pin -appdebug -t obj-intel64/stack-debugger.so -- obj-intel64/fibonacci.exe 1000
Application stopped until continued from debugger.
Start GDB, then issue this command at the prompt:
  target remote :33030
In another window, start the debugger and enter the command that Pin printed:
Linux:
$ gdb fibonacci
(gdb) target remote :33030
At this point, the debugger is attached to the application that is running under Pin. You can set breakpoints, continue execution, print out variables, disassemble code, etc.
Linux:
(gdb) break main
Breakpoint 1 at 0x401194: file fibonacci.cpp, line 12.
(gdb) cont
Continuing.

Breakpoint 1, main (argc=2, argv=0x7fbffff3c8) at fibonacci.cpp:12
12          if (argc > 2)
(gdb) print argc
$1 = 2
(gdb) x/4i $pc
0x401194 <main+27>:     cmpl   $0x2,0xfffffffffffffe5c(%rbp)
0x40119b <main+34>:     je     0x4011c8 <main+79>
0x40119d <main+36>:     mov    $0x402080,%esi
0x4011a2 <main+41>:     mov    $0x603300,%edi
Of course, any information you observe in the debugger shows the application's "pure" state. The details of Pin and the tool's instrumentation are hidden. For example, the disassembly you see above shows only the application's instructions, not any of the instructions inserted by the tool. However, when you use commands like "cont" or "step" to advance execution of the application, your tool's instrumentation runs as it normally would under Pin.
- Note
- After connecting the debugger, you should NOT use the "run" command. The application is already running and stopped at the first instruction. Instead, use the "cont" command to continue execution.
Adding New Debugger Commands
The previous section illustrated how you can enable the normal debugger features while running an application under Pin. Now, let's see how your Pintool can add new custom debugger commands, even without changing the debugger itself. Custom debugger commands are useful because they allow you to control your Pintool interactively from within a live debugger session. For example, you can ask your Pintool to print out information that it has collected, or you can interactively enable instrumentation only for certain phases of the application.
To illustrate, see the call to PIN_AddDebugInterpreter() in the stack-debugger tool. That API sets up the following call-back function:
The PIN_AddDebugInterpreter() API allows a Pintool to establish a handler for extended debugger commands. For example, the code snippet above implements the new commands "stats" and "stacktrace on". You can execute these commands in the debugger by using the "monitor" command:
Linux:
(gdb) monitor stats
Current stack usage: 688 bytes.
Maximum stack usage: 0 bytes.
A Pintool can do various things when the user types an extended debugger command. For example, the "stats" command prints out some information that the tool has collected. Any text that the tool writes to the "result" parameter is printed to the debugger console. Note that the CONTEXT parameter has the register state for the debugger's "focus" thread, so the tool can easily display information about this focus thread.
You can also use an extended debugger command to interactively enable or disable instrumentation in your Pintool, as demonstrated by the "stacktrace on" command. For example, if you wanted to quickly run your Pintool over the application's initial start-up phase, you could run with your Pintool's instrumentation disabled until a breakpoint is triggered. Then, you could use an extended command to enable instrumentation only during the interesting part of the application. In the stack-debugger example above, the call to PIN_RemoveInstrumentation() causes Pin to discard any previous instrumentation, so the tool re-instruments the code when the debugger continues execution of the application. As we will see later, the tool's global variable "EnableInstrumentation" adjusts the instrumentation that it inserts.
Semantic Breakpoints
The last major feature of the advanced debugging extensions is the ability to stop execution at a breakpoint by calling an API from your tool's analysis code. This may sound simple, but it is very powerful. Your Pintool can use instrumentation to look for a complex condition and then stop at a breakpoint when that condition occurs.
The "stack-debugger" tool illustrates this by using instrumentation to observe all the instructions that allocate stack space, and then it stops at a breakpoint whenever the application's stack usage reaches some threshold. In effect, this adds a new feature to the debugger that could not be practically implemented using traditional debugger technology because a traditional debugger can not reasonably find all the instructions that allocate stack space. A Pintool, however, can do this quite easily via instrumentation.
The example code below from the "stack-debugger" tool uses Pin instrumentation to identify all the instructions that allocate stack space.
The call to INS_RegWContain() tests whether an instruction modifies the stack pointer. If it does, we insert an analysis call immediately after the instruction, which checks to see if the application's stack usage exceeds a threshold.
Also notice that all the instrumentation is gated by the global flag "EnableInstrumentation", which we saw earlier in the "stacktrace on" command. Thus, the user can disable instrumentation (with "stacktrace off") in order to execute quickly through uninteresting parts of the application, and then re-enable it (with "stacktrace on") for the interesting parts.
The analysis routine OnStackChangeIf() returns TRUE if the application's stack usage has exceeded the threshold. When this happens, the tool calls the DoBreakpoint() analysis routine, which will stop at the debugger breakpoint. Notice that we use if / then instrumentation here because the call to DoBreakpoint() requires a "CONTEXT *" parameter, which can be slow.
The analysis routine OnStackChangeIf() keeps track of some metrics on stack usage and tests whether the threshold has been reached. If the threshold is crossed, it returns non-zero, and Pin executes the DoBreakpoint() analysis routine.
The interesting part of DoBreakpoint() is at the very end, where it calls PIN_ApplicationBreakpoint(). This API causes Pin to stop the execution of all threads and triggers a breakpoint in the debugger. There is also a string parameter to PIN_ApplicationBreakpoint(), which the debugger prints at the console when the breakpoint triggers. A Pintool can use this string to tell the user why a breakpoint triggered. In our example tool, this string says something like "Thread 10 uses 4000 bytes of stack".
Please refer to the documentation of PIN_ApplicationBreakpoint() and read the note about avoiding an infinite loop of calls to the analysis function.
We can see the breakpoint feature in action in our example tool by using the "stackbreak 4000" command like this:
Linux:
(gdb) monitor stackbreak 4000
Will break when thread uses more than 4000 bytes of stack.
(gdb) c
Continuing.
Thread 0 uses 4000 bytes of stack.
Program received signal SIGTRAP, Trace/breakpoint trap.
0x0000000000400e27 in Fibonacci (num=0) at fibonacci.cpp:34
(gdb)
When you are done, you can either continue the application and let it terminate, or you can quit from the debugger:
Linux:
(gdb) quit
The program is running.  Exit anyway? (y or n) y
Connecting the Debugger Later
In the previous example, we used the Pin switch -appdebug to stop the application and debug it from the first instruction. You can also enable Pin's debugging extensions without stopping at the first instruction. The following example shows how you can use the stack-debugger tool to start the application and attach with the debugger only after it triggers a stack limit breakpoint.
Linux:
$ ../../../pin -appdebug_enable -appdebug_silent -t obj-intel64/stack-debugger.so -stackbreak 4000 -- obj-intel64/fibonacci 1000
The -appdebug_enable switch tells Pin to enable application debugging without stopping at the first instruction. The -appdebug_silent switch disables the message that tells how to connect with the debugger. As we will see later, the Pintool can print a custom message instead. Finally, the "-stackbreak 4000" switch tells the stack-debugger tool to trigger a breakpoint when the stack grows to 4000 bytes. When the tool does trigger a breakpoint, it prints a message like this:
Linux:
Triggered stack-limit breakpoint.
Start GDB and enter this command:
  target remote :45462
You can now connect with the debugger as you did before, except now the debugger stops the application at the point where the stack-debugger tool triggered the stack-limit breakpoint.
Linux:
gdb fibonacci
(gdb) target remote :45462
0x0000000000400e27 in Fibonacci (num=0) at fibonacci.cpp:37
(gdb)
Let's look at the code in the tool that connects to the debugger now.
The ConnectDebugger() function is called each time the tool wants to stop at a breakpoint. It first calls PIN_GetDebugStatus() to see if Pin is already connected to a debugger. If not, it uses PIN_GetDebugConnectionInfo() to get the TCP port number that is needed to connect the debugger to Pin. This is, for example, the "45462" number that the user types in the "target remote" command. After asking the user to start the debugger, the tool then calls PIN_WaitForDebuggerToConnect() to wait for the debugger to connect. If the user doesn't start the debugger after a timeout period, the tool prints a message and then continues executing the application.
As before, you can either continue the application and let it terminate, or you can quit from the debugger:
Linux:
(gdb) quit
The program is running.  Exit anyway? (y or n) y
Advanced Debugging Extensions on Windows
On Windows, the advanced debugging extensions work with Microsoft Visual Studio 2012 or greater. There is no support for earlier versions of Visual Studio, so make sure you have that version installed. Also, the Express edition of Visual Studio doesn't support IDE extensions, so it will not work with the Pin debugger extensions. Therefore, you must install the Professional edition (or greater). If you are a student, you may be able to get the Professional edition for free. Check the Microsoft web site or with your school's IT department for details.
After you have installed Visual Studio, you must also install the Pin extension for Visual Studio. Look for an installer named "pinadx-vsextension-X.Y.bat" in the root of the Pin kit. Run it as administrator.
The remainder of this section assumes that you are able to build the "stack-debugger" tool, so if you want to follow along, you must have the following software installed:
- Visual Studio 2012, Professional edition (or greater).
- The Pin debugger extension for Visual Studio 2012 or greater (pinadx-vsextension-X.Y.bat).
In order to start this tutorial, you will probably want to build the example tool "stack-debugger.cpp", which is available in the directory "source\tools\ManualExamples". To do this, open a Visual Studio command shell and type the following commands. (Use "TARGET=intel64" instead, if you want to build a 64-bit version of the tool.)
C:\> cd source\tools\ManualExamples
C:\> make TARGET=ia32 obj-ia32/stack-debugger.dll
After you have done this, start Visual Studio and open the sample solution file at "source\tools\ManualExamples\stack-debugger-tutorial.sln". Then build the sample application "fibonacci" by pressing F7. Make sure you can run the application natively by pressing CTRL-F5.
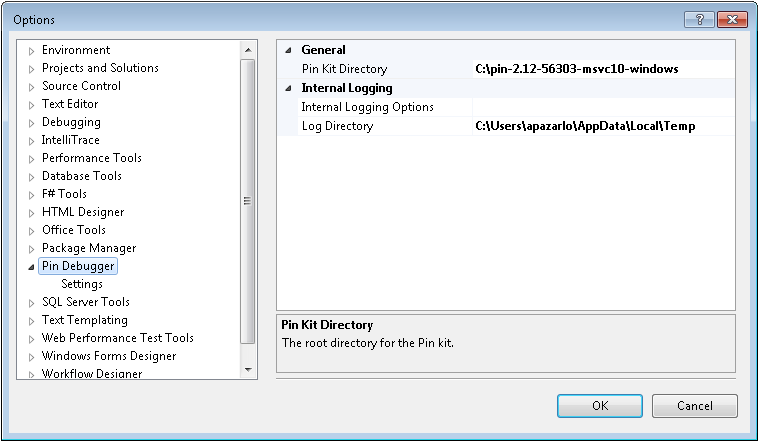
Now let's try running the "fibonacci" application under Pin with the "stack-debugger" tool. To do this, you must first set the "Pin Kit Directory" from TOOLS->Options->Pin Debugger.
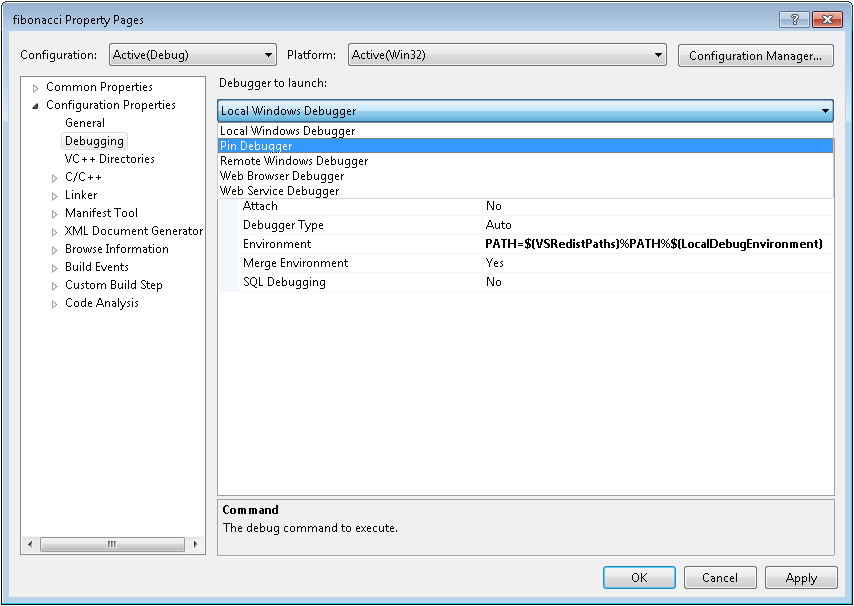
Then you have to adjust the "fibonacci" project properties in Visual Studio: right-click on the "fibonacci" project in the Solution Explorer, choose Properties, and then click on Debugging. Change the drop-down titled "Debugger to launch" to "Pin Debugger" as shown in the figure below.
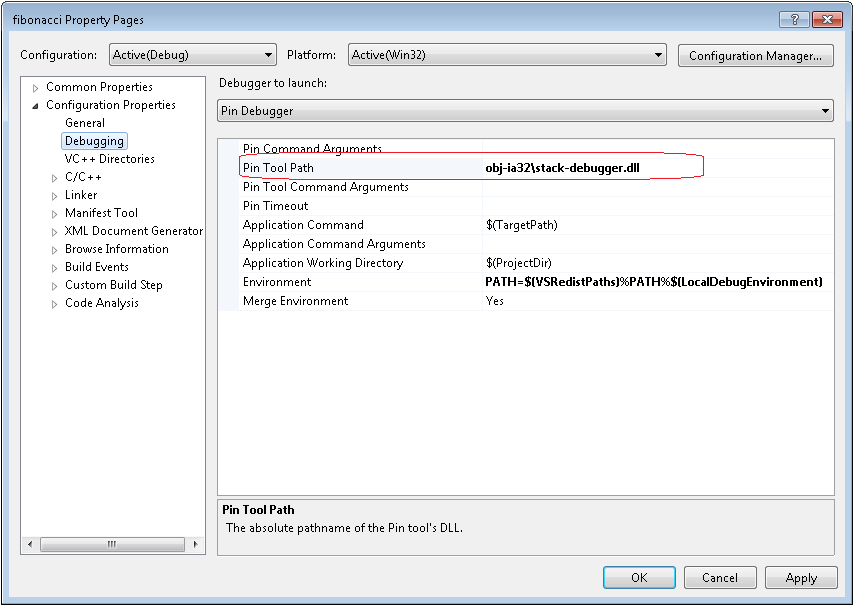
Then, set the "Pin Tool Path" property by browsing to the "stack-debugger.dll". Press OK when you are done.
Visual Studio is now configured to run the "fibonacci" application under your Pintool. However, before you continue, set a breakpoint in "main()" so that execution stops in the debugger. Then press F5 to start debugging.
You should now see a normal-looking debugger session, although your application is really running under control of Pin. All of the debugger features still work as you would expect. You can set breakpoints, continue execution, display the values of variables, and even view the disassembled code. All of the information that you observe in the debugger shows the application's "pure" state. The details of Pin and the tool's instrumentation are hidden. For example, the disassembly view shows only the application's instructions, not any of the instructions inserted by the tool. However, when you continue execution (e.g. with F5 or F10), the application executes along with your tool's instrumentation code.
Now, let's see an alternative way to debug the "fibonacci" application under Pin with the "stack-debugger" tool in Visual Studio. After you have built the "stack-debugger" tool, open a command shell and start the application with the debugging extensions enabled. This will cause Pin to stop immediately before the first instruction.
C:\> cd source\tools\ManualExamples
C:\> ..\..\..\pin -appdebug -t obj-ia32\stack-debugger.dll -- debug\fibonacci.exe 1000
Application stopped until continued from debugger.
Pin ready to accept debugger connection on port 30840
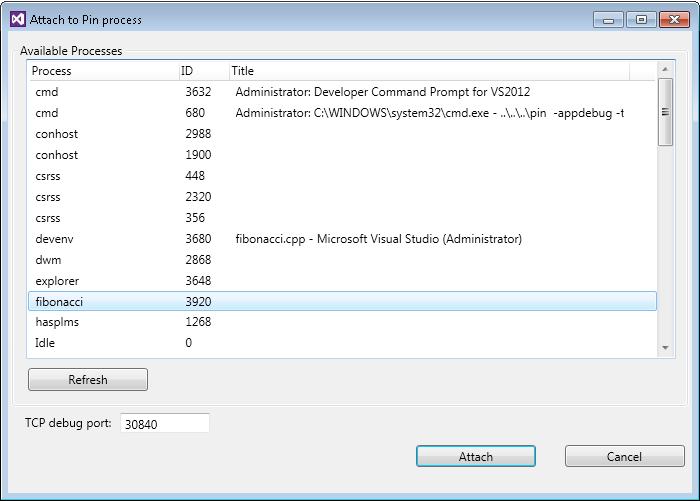
Open the source\tools\ManualExamples\fibonacci.cpp in Visual Studio and set a breakpoint to stop the execution in the debugger. To attach with Visual Studio to the process that is running under Pin, select "Attach to Pin Process" on the DEBUG menu. Select from the Available Processes table the "fibonacci" process, enter the port number that Pin printed and click Attach.
Adding New Debugger Commands
The previous section illustrated how you can enable the normal debugger features while running an application under Pin. Now, let's see how your Pintool can add new custom debugger commands, even without changing Visual Studio. Custom debugger commands are useful because they allow you to control your Pintool interactively from within a live debugger session. For example, you can ask your Pintool to print out information that it has collected, or you can interactively enable instrumentation only for certain phases of the application.
To illustrate, see the call to PIN_AddDebugInterpreter() in the stack-debugger tool. That API sets up the following call-back function:
The PIN_AddDebugInterpreter() API allows a Pintool to establish a handler for extended debugger commands. For example, the code snippet above implements the new commands "stats" and "stacktrace on". You can execute these commands in Visual Studio by opening "DEBUG->Windows->Pin Console" in the IDE.
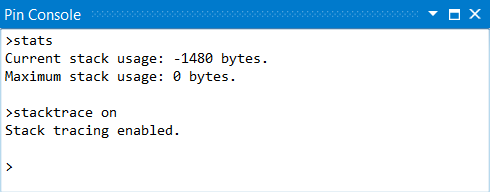
A Pintool can do various things when the user types an extended debugger command. For example, the "stats" command prints out some information that the tool has collected. Any text that the tool writes to the "result" parameter is printed to the Visual Studio Pin Console window. Note that the CONTEXT parameter has the register state for the debugger's "focus" thread, so the tool can easily display information about this focus thread.
You can also use an extended debugger command to interactively enable or disable instrumentation in your Pintool, as demonstrated by the "stacktrace on" command. For example, if you wanted to quickly run your Pintool over the application's initial start-up phase, you could run with your Pintool's instrumentation disabled until a breakpoint is triggered. Then, you could use an extended command to enable instrumentation only during the interesting part of the application. In the stack-debugger example above, the call to PIN_RemoveInstrumentation() causes Pin to discard any previous instrumentation, so the tool re-instruments the code when the debugger continues execution of the application. As we will see later, the tool's global variable "EnableInstrumentation" adjusts the instrumentation that it inserts.
Semantic Breakpoints
The last major feature of the advanced debugging extensions is the ability to stop execution at a breakpoint by calling an API from your tool's analysis code. This may sound simple, but it is very powerful. Your Pintool can use instrumentation to look for a complex condition and then stop at a breakpoint when that condition occurs.
The "stack-debugger" tool illustrates this by using instrumentation to observe all the instructions that allocate stack space, and then it stops at a breakpoint whenever the application's stack usage reaches some threshold. In effect, this adds a new feature to the debugger that could not be practically implemented using traditional debugger technology because a traditional debugger can not reasonably find all the instructions that allocate stack space. A Pintool, however, can do this quite easily via instrumentation.
The example code below from the "stack-debugger" tool uses Pin instrumentation to identify all the instructions that allocate stack space.
The call to INS_RegWContain() tests whether an instruction modifies the stack pointer. If it does, we insert an analysis call immediately after the instruction, which checks to see if the application's stack usage exceeds a threshold.
Also notice that all the instrumentation is gated by the global flag "EnableInstrumentation", which we saw earlier in the "stacktrace on" command. Thus, the user can disable instrumentation (with "stacktrace off") in order to execute quickly through uninteresting parts of the application, and then re-enable it (with "stacktrace on") for the interesting parts.
The analysis routine OnStackChangeIf() returns TRUE if the application's stack usage has exceeded the threshold. When this happens, the tool calls the DoBreakpoint() analysis routine, which will stop at the debugger breakpoint. Notice that we use if / then instrumentation here because the call to DoBreakpoint() requires a "CONTEXT *" parameter, which can be slow.
The analysis routine OnStackChangeIf() keeps track of some metrics on stack usage and tests whether the threshold has been reached. If the threshold is crossed, it returns non-zero, and Pin executes the DoBreakpoint() analysis routine.
The interesting part of DoBreakpoint() is at the very end, where it calls PIN_ApplicationBreakpoint(). This API causes Pin to stop the execution of all threads and triggers a breakpoint in the debugger. There is also a string parameter to PIN_ApplicationBreakpoint(), which is displayed in Visual Studio when the breakpoint triggers. A Pintool can use this string to tell the user why a breakpoint triggered. In our example tool, this string says something like "Thread 10 uses 4000 bytes of stack".
We can see the breakpoint feature in action in our example tool by typing this command in the Pin Console window:
>stackbreak 4000
Will break when thread uses more than 4000 bytes of stack.
Then press F5 to continue execution. The application should stop in the debugger again with a message like this:
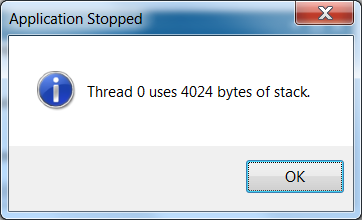
When you are done, you can either continue the application with F5 or terminate it with SHIFT-F5.
Applying a Pintool to an Application
An application and a tool are invoked as follows:
pin [pin-option]... -t [toolname] [tool-options]... -- [application] [application-option]..
These are a few of the Pin options are currently available. See Command Line Switches for the complete list.
- -t toolname: Specifies the Pintool to use. If you are running a 32-bit application in an IA-32 architecture, or a 64-bit application on an Intel(R) 64 architecture, only -t <toolname> is needed. If you are running an application on an Intel(R) 64 architecture, where all of the components in the chain are either 32-bit or 64-bit, but not both, only -t <toolname> is needed. If you are running an application on an Intel(R) 64 architecture, where components in the chain are both 32-bit and 64-bit, use -t64 <64-bit toolname> to specify the 64-bit tool binary followed by -t <32-bit toolname> to specify the 32-bit tool binary and the tool options. For more information, see Instrumenting Applications on Intel(R) 64 Architectures
-
-t64 toolname: Specify 64-bit tool binary for Intel(R) 64 architecture. If you are running an application on an Intel(R) 64 architecture, where components in the chain are both 32-bit and 64-bit, use -t64 together with -t as described above. See Instrumenting Applications on Intel(R) 64 Architectures.
Important: Using -t64 without -t is not recommended, since in this case when given a 32-bit application, Pin will run the application without applying any tool. - -p32 toolname: Specify Pin binary for IA-32 architecture. See Instrumenting Applications on Intel(R) 64 Architectures
- -p64 toolname: Specify Pin binary for Intel(R) 64 architecture. See Instrumenting Applications on Intel(R) 64 Architectures
- -pause_tool n: is a useful Pin-option which prints out the process id and pauses Pin for n seconds to permit attaching with gdb. See Tips for Debugging a Pintool.
- -follow_execv: Execute with Pin all processes spawned by execv class system calls.
-
-injection mode: Where mode is one of dynamic, self, child, parent. UNIX-only See Injection.
The tool-options follow immediately after the tool specification and depend on the tool used.
Everything following the – is the command line for the application.
For example, to apply the itrace example (Instruction Address Trace (Instruction Instrumentation)) to a run of the "ls" program:
../../../pin -t obj-intel64/itrace.so -- /bin/ls
To get a listing of the available command line options for Pin:
pin -help
To get a listing of the available command line options for the itrace example:
../../../pin -t obj-intel64/itrace.so -help -- /bin/ls
Note that in the last case /bin/ls is necessary on the command line but will not be executed.
Instrumenting Applications on Intel(R) 64 Architectures
The Pin kit for IA-32 and Intel(R) 64 architectures is a combined kit. Both a 32-bit version and a 64-bit version of Pin are present in the kit. This allows Pin to instrument complex applications on Intel(R) 64 architectures which may have 32-bit and 64-bit components.
An application and a tool are invoked in "mixed-mode" as follows:
pin [pin-option]... -t64 <64-bit toolname> -t <32-bit toolname> [tool-options]...
-- <application> [application-option]..
Please note:
- The -t64 option must precede the -t option.
- When using -t64 together with -t, -t specifies the 32-bit tool. Using -t64 without -t is not recommended, since in this case when given a 32-bit application, Pin will run the application without applying any tool.
- The [tool-options] apply to both the 64-bit and the 32-bit tools and must be specified after -t <32-bit toolname>. It is not possible to specify different set of options for the 64-bit and the 32-bit tools.
See source/tools/CrossIa32Intel64/makefile for a few examples.
The file "pin" is a c-based launcher executable that expects the Pin binary "pinbin" to be in the architecture-specific "bin" subdirectory (i.e. intel64/bin). The "pin" launcher distinguishes the 32-bit version of the Pin binary from the 64-bit version of the Pin binary by using the -p32/-p64 switches, respectively. Today, the 32-bit version of the Pin binary is invoked, and the path of the 64-bit version of Pin is passed as an argument using the -p64 switch. However, one could change this to invoke the 64-bit version of the Pin binary, and pass the 32-bit version of the Pin binary as an argument using the -p32 switch.
Injection
The -injection switch is UNIX-only and controls the way Pin is injected into the application process. The default, dynamic, is recommended for all users. It uses parent injection unless it is unsupported (Linux 2.4 kernels). Child injection creates the application process as a child of the pin process so you will see both a pin process and the application process running. In parent injection, the pin process exits after injecting the application and is less likely to cause a problem. Using parent injection on an unsupported platform may lead to nondeterministic errors.
IMPORTANT: The description about invoking assumes that the application is a program binary (and not a shell script). If your application is invoked indirectly (from a shell script or using 'exec') then you need to change the actual invocation of the program binary by prefixing it with Pin/Pintool options. Here's one way of doing that:
 # Track down the actual application binary, say it is 'application_binary'.
 % mv application_binary application_binary.real

 # Write a shell script named 'application_binary' with the following contents.
 # (change 'itrace' to your desired tool)

 #!/bin/sh
 ../../../pin -t obj-intel64/itrace.so -- application_binary.real $*
After you do this, whenever 'application_binary' is invoked indirectly (from some shell script or using 'exec'), the real binary will get invoked with the right Pin/Pintool options.
Restrictions
There is a known problem of using Pin on systems protected by the "McAfee Host Intrusion Prevention"* antivirus software. We did not test coexistence of Pin with other antivirus products that perform run-time execution monitoring.
There is a known limitation of using Pin on Linux systems that prevent the use of ptrace attach via the sysctl /proc/sys/kernel/yama/ptrace_scope. Pin will still work when launching applications with the pin command line. However, Pin will fail in attach mode (that is, using the -pid knob). To resolve this, do the following (as root):
$ echo 0 > /proc/sys/kernel/yama/ptrace_scope
Tips for Debugging a Pintool
Using gdb on Linux
When running an application under the control of Pin and a Pintool there are two different programs residing in the address space. The application, and the Pin instrumentation engine together with your Pintool. The Pintool is normally a shared object loaded by Pin. This section describes how to use gdb to find bugs in a Pintool. You cannot run Pin directly from gdb since Pin uses the debugging API to start the application. Instead, you must invoke Pin from the command line with the -pause_tool switch, and use gdb to attach to the Pin process from another window. The -pause_tool n switch makes Pin print out the process identifier (pid) and pause for n seconds.
Pin searches for the tool in an internal search algorithm. Therefore in many cases gdb is unable to load the debug info for the tool. There are several options to help gdb find the debug info.
 Option 1 is to use full path to the tool when running pin.

 Option 2 is to tell gdb to load the debugging information of the tool.
 Pin prompts with the exact gdb command to be used in this case.
To check that gdb loaded the debugging info to the tool use the command "info sharedlibrary" and you should see that gdb has read the symbols for your tool (as in the example below).
(gdb) info sharedlibrary
From        To          Syms Read   Shared Object Library
0x001b3ea0  0x001b4d80  Yes         /lib/libdl.so.2
0x003b3820  0x00431d74  Yes         /usr/intel/pkgs/gcc/4.2.0/lib/libstdc++.so.6
0x0084f4f0  0x00866f8c  Yes         /lib/i686/libm.so.6
0x00df8760  0x00dffcc4  Yes         /usr/intel/pkgs/gcc/4.2.0/lib/libgcc_s.so.1
0x00e5fa00  0x00f60398  Yes         /lib/i686/libc.so.6
0x40001c50  0x4001367f  Yes         /lib/ld-linux.so.2
0x008977f0  0x00af7784  Yes         ./dcache.so
 For example, if your tool is called opcodemix and the application is /bin/ls,
 you can use gdb as described below. The following example is for the Intel(R) 64 Linux platform.
 Substitute "ia32" for the IA-32 architecture.

 Change directory to the directory where your
 tool resides, and start gdb with pin, but do not use the run command.
$ /usr/bin/gdb ../../../intel64/bin/pinbin
GNU gdb Red Hat Linux (6.3.0.0-1.132.EL4rh)
Copyright 2004 Free Software Foundation, Inc.
GDB is free software, covered by the GNU General Public License, and you are
welcome to change it and/or distribute copies of it under certain conditions.
Type "show copying" to see the conditions.
There is absolutely no warranty for GDB.  Type "show warranty" for details.
This GDB was configured as "x86_64-redhat-linux-gnu"...Using host libthread_db library "/lib64/tls/libthread_db.so.1"
(gdb)
In another window, start your application with the -pause_tool switch.
$ ../../../pin -pause_tool 10 -t obj-intel64/opcodemix.so -- /bin/ls
Pausing for 10 seconds to attach to process with pid 28769
To load the tool's debug info to gdb use:
   add-symbol-file .../source/tools/SimpleExamples/obj-intel64/opcodemix.so 0x2a959e9830
Then go back to gdb and attach to the process.
(gdb) attach 28769
Attaching to program: .../intel64/bin/pinbin, process 28769
0x000000314b38f7a2 in ?? ()
(gdb)
Now, you should tell gdb to load the Pintool debugging information, by copying the debugging message we got when invoking pin with the -pause_tool switch..
(gdb) add-symbol-file .../source/tools/SimpleExamples/obj-intel64/opcodemix.so 0x2a959e9830
add symbol table from file ".../source/tools/SimpleExamples/obj-intel64/opcodemix.so" at
        .text_addr = 0x2a959e9830
        (y or n) y
        Reading symbols from .../source/tools/SimpleExamples/obj-intel64/opcodemix.so...done.
(gdb)
Now, instead of using the gdb run command, you use the cont command to continue execution. You can also set breakpoints as normal.
(gdb) b opcodemix.cpp:447
Breakpoint 1 at 0x2a959ecf60: file opcodemix.cpp, line 447.
(gdb) cont
Continuing.

Breakpoint 1, main (argc=7, argv=0x3ff00f12f8) at opcodemix.cpp:447
447     int main(int argc, CHAR *argv[])
(gdb)
If the program does not exit, then you should detach so gdb will release control.
(gdb) detach
Detaching from program: .../intel64/bin/pinbin, process 28769
(gdb)
If you recompile your program and then use the run command, gdb will notice that the binary has been changed and reread the debug information from the file. This does not always happen automatically when using attach. In this case you must use the "add-symbol-file" command again to make gdb reread the debug information.
Using the Visual Studio Debugger on Windows
When running an application under the control of Pin and a Pintool there are two different programs residing in the address space. The application, and the Pin instrumentation engine together with your Pintool. The Pintool is a dynamically loaded library (.dll) loaded by Pin. This section describes how to use the Visual Studio Debugger to find bugs in a Pintool. You cannot run Pin directly from the debugger since Pin uses the debugging API to start the application. Instead, you must invoke Pin from the command line with the -pause_tool switch, and use Visual Studio to attach to the Pin process from another window. The -pause_tool n switch makes Pin print out the process identifier (pid) and pause for n seconds. You have n seconds (20 in our example) to attach the application with the debugger. Note, application resumes once the timeout expires. Attaching debugger later will not have the desired effect.
 % pin <pin options> -pause_tool 20 -t <tool name>  <tool options> -- <app name> <app options>
Pausing for 20 seconds to attach to process with pid 28769
In the Visual Studio window, attach to the application process using the "Debug"->"Attach to Process" menu selection and wait until a breakpoint occurs. Then you can set breakpoints in your tool in the usual way.
Note, it is necessary to build your Pintool with debug symbols if you want symbolic information.
Using the WinDbg Debugger on Windows
WinDbg Debugger is the only available option to debug Pintool when it is necessary to attach to an instrumented process after Pin initialization. It also could be used instead of Visual Studio Debugger in scenario described above. The debugger is available at https://msdn.microsoft.com/en-us/library/windows/hardware/ff551063(v=vs.85).aspx
The following steps are necessary to properly debug Pintool in instrumented process:
  - Install latest WinDbg and Process Explorer utility
    ( https://technet.microsoft.com/en-us/sysinternals/processexplorer.aspx )
  - Add Microsoft Symbol Server settings in WinDbg: in "File" -> "Symbol File Path"
    type <b> srv*c:\\symbols*http://msdl.microsoft.com/download/symbols </b>.
    Create c:\\symbols directory that will serve as local repository for OS DLLs symbols.
  - Attach WinDbg to an instrumented process. Architectures of WinDbg and the process should match.
  - Use Process Explorer to notice location of hidden DLLs (Pintool DLL, its dependencies and pinvm.dll).
    Select process of interest in Process View, type <em>Ctrl-D</em> , then double-click
    on each hidden DLL of interest in DLL View to get location info.
  - When Windbg stops after attach, enter the following command for each hidden DLL:
.reload /f <name>=<address>,<size>
where <name> is DLL base name, <address> is its actual base address and <size> is its actual size in memory. Example:
.reload /f mytool.dll=0x50200000,0x420000
- From now on you can set breakpoints using symbolic info of the DLLs and see comprehensive call stacks.
Logging Messages from a Pintool
Pin provides a mechanism to write messages from a Pintool to a logfile. To use this capability, call the LOG() API with your message. The default filename is pintool.log, and it is created in the currently working directory. Use the -logfile switch after the tool name to change the path and file name of the log file.
Performance Considerations When Writing a Pintool
The way a Pintool is written can have great impact on the performace of the tool, i.e. how much it slows down the applications it is instrumenting. This section demonstrates some techniques that can be used to improve tool performance. Let's start with an example. The following piece of code is derived from the source/tools/SimpleExamples/edgcnt.cpp:
The instrumentation component of the tool is show below
The analysis component looks like this:
The purpose of the tool is to count how often each controlflow changing edge in the control flowgraph is traversed. The tool considers both calls and branches but for brevity we will not mention branches in our description. The tool works as follows: The instrumentation component instruments each branch with a call to docount2. As parameters we pass in the origin and the target of the branch and whether the branch was taken or not. Branch origin and target represent of the source and destination of the controlflow edges. If a branch is not taken the controlflow does not change and hence the analysis routine returns right away. If the branch is taken we use the src and dst parameters to look up the counter associated with this edge (Lookup will create a new one if this edge has not been seen before) and increment the counter. Note, that the tool could have been simplified somewhat by using IPOINT_TAKEN_BRANCH option with INS_InsertCall().
Shifting Computation for Analysis to Instrumentation Code
About every 5th instruction executed in a typical application is a branch. Lookup will called whenever these instruction are executed, causing significant application slowdown. To improve the situation we note that the instrumentation code is typically called only once for every instruction, while the analysis code is called everytime the instruction is executed. If we can somehow shift computation from the analysis code to the instrumentation code we will improve the overall performance. Our example tools offer multiple such opportunites which will explore in turn. The first observation is that for most branches we can find out inside of Instruction() what the branch target will be . For those branches we can call Lookup inside of Instruction() rather than in docount2(), for indirect branches which are relatively rare we still have to use our original approach. All this is reflected in the folling code. We add a second "lighter" analsysis function, docount. While the original docount2() remains unchanged:
And the instrumentation will be somewhat more complex:
Eliminating Control Flow
The code for docount() is very compact which provides performance advantages; it may also allow it to be inlined by Pin, thereby avoiding the overhead of a call. The heuristics for when a analysis routine is inlined by Pin are subject to change. But small routines without any control flow (single basic block) are almost guaranteed to be inlined. Unfortunately, docount() does have (albeit limited) control flow. Observing that the parameter, 'taken', will be zero or one we can eliminate the remaining control flow as follows:
Now docount() can be inlined.
@endsubsection
Compiler Considerations for Inlining
The way that the tool is built affects inlining as well. If an analysis routine has a function call to another function, it would not be a candidate for inlining by Pin unless the function call was inlined by the compiler. If the function call is inlined by the compiler, the analysis routine would be a candidate for inlining by Pin. Therefore, it is advisable to write any subroutines called by the analysis routine in a way that allows the compiler to inline the subroutines.
On Linux IA-32 architectures, Pintools are built non-PIC (Position Independent Code), which allows the compiler to inline both local and global functions. Tools for Linux Intel(R) 64 architectures are built PIC, but the compiler will not inline any globally visible function due to function pre-emption. Therefore, it is advisable to declare the subroutines called by the analysis function as 'static' on Linux Intel(R) 64 architectures.
@endsubsection
Letting Pin Decide Where to Instrument
At times we do not care about the exact point where calls to analysis code are being inserted as long as it is within a given basic block. In this case we can let Pin make the decission where to insert. This has the advantage that Pin can select am insertion point that requires minimal register saving and restoring. The following code from ManualExamples/inscount2.cpp shows how this is done for the instruction count example using IPOINT_ANYWHERE with BBL_InsertCall().
Using Fast Call Linkages
For very small analysis functions, the overhead to call the function can be comparable to the work done in the function. Some compilers offer optimized call linkages that eliminate some of the overhead. For example, gcc for the IA-32 architecture has a regparm attribute for passing arguments in registers. Pin supports a limited number of alternate linkages. To use it, you must annotate the declaration of the analysis function with PIN_FAST_ANALYSIS_CALL. The InsertCall function must pass IARG_FAST_ANALYSIS_CALL. If you change one without changing the other, the arguments will not be passed correctly. See the inscount2.cpp example in the previous section for a sample use. For large analysis functions, the benefit may not be significant, but it is unlikely that PIN_FAST_ANALYSIS_CALL would ever cause a slowdown.
Another call linkage optimization is to eliminate the frame pointer. We recommend using -fomit-frame-pointer to compile tools with gcc. See the gcc documentation for an explanation of what it does. The standard Pintool makefiles include -fomit-frame-pointer. Like PIN_FAST_ANALYSIS_CALL, the benefit is largest for small analysis functions. Debuggers rely on frame pointers to display stack traces, so eliminate this option when trying to debug a PinTool. If you are using a standard PinTool makefile, you can do this by overriding the definition of OPT on the command line with
make OPT=-O0
Rewriting Conditional Analysis Code to Help Pin Inline
Pin improves instrumentation performance by automatically inlining analysis routines that have no control-flow changes. Of course, many analysis routines do have control-flow changes. One particularly common case is that an analysis routine has a single "if-then" test, where a small amount of analysis code plus the test is always executed but the "then" part is executed only once a while. To inline this common case, Pin provides a set of conditional instrumentation APIs for the tool writer to rewrite their analysis routines into a form that does not have control-flow changes. The following example from source/tools/ManualExamples/isampling.cpp illustrates how such rewriting can be done:
In the above example, the original analysis routine IpSample() has a conditional control-flow change. It is rewritten into two analysis routines: CountDown() and PrintIp(). CountDown() is the simpler one of the two, which doesn't have control-flow change. It also performs the original conditional test and returns the test result. We use the conditional instrumentaton APIs INS_InsertIfCall() and INS_InsertThenCall() to tell Pin that tbe analysis routine specified by an INS_InsertThenCall() (i.e. PrintIp() in this example) is executed only if the result of the analysis routine specified by the previous INS_InsertIfCall() (i.e. CountDown() in this example) is non-zero. Now CountDown(), the common case, can be inlined by Pin, and only once a while does Pin need to execute PrintIp(), the non-inlined case.
Optimizing Instrumentation of REP Prefixed Instructions
The IA-32 and Intel(R) 64 architectures include REP prefixed string instructions. These use a REP prefix on a string operation to repeat the execution of the inner operation. For some instructions the repeat count is determined solely by the value in the count register. For others (SCAS,CMPS), the count register provides an upper limit on the number of iterations, while the REP opcode provides a condition to be tested which can exit the REP loop before the full number of iterations has been executed.
Pin treats REP prefixed instructions as an implicit loop around the inner instruction, so IPOINT_BEFORE and IPOINT_AFTER instrumentation is executed for that instruction once for each iteration of the (implicit) loop. Since each execution of the inner instruction is instrumented, IARG_MEMORY{READ,READ2,WRITE}_SIZE can be determined statically from the instruction (1,2,4,8 bytes), and IARG_MEMORY{OP,READ,READ2,WRITE}_EA can also be determined (even if DF==1, so the inner instructions are decrementing their arguments and moving backwards through store).
REP prefixed instructions are treated as predicated, where the predicate is that the count register is non-zero. Therefore canonical instrumentation for memory accesses such as
will see all of the memory accesses made by the REP prefixed operations.
To allow tools to count entries into a REP prefixed instruction, and to optimize, Pin provides IARG_FIRST_REP_ITERATION, which can be passed as an argument to an analysis routine. It is TRUE if this is the first iteration of a REP prefixed instruction, FALSE otherwise.
Thus to perform an action only on the first iteration of a REP prefixed instruction, one can use code like this (assuming that "takeAction" wants to be called on the first iteration of all REP prefixed instructions, even ones with a zero repeat count):
To obtain the repeat count, you can use
which will pass the value in the appropriate count register (one of REG_CX,REG_ECX,REG_RCX depending on the instruction).
As an example, here is code which counts the number of times REP prefixed instructions are executed, optimizing cases in which the REP prefixed instruction only depends on the count register.
To perform this optimization when collecting memory access addresses, you will also need to worry about the state of EFLAGS.DF, since the string operations work from high address to low address when EFLAGS.DF==1.
(Note: REG_EFLAGS enum represents eflags register, used on 32-bit systems only. For 64-bit systems use REG_RFLAGS enum, or REG_GFLAGS enum, which represents either rflags or eflags register depending on the system architecture)
Here is an example which shows how to handle that.
Since there are real codes where a significant proportion of all instructions are REP prefixed, using IARG_FIRST_REP_ITERATION to collect information at the beginning of the REP "loop" while skipping it for the later iterations can be a significant optimization.
A tool which demonstrates all of these techniques can be found in source/tools/ManualExamples/countreps.cpp, from which these (slightly edited) code snippets were taken.
Memory management
Pin
Pin allows the Pintool to dynamically allocate memory (e.g. using malloc()) without interfering with the execution of the application that is run under Pin. In order to achieve this, Pin implements its own memory allocator which is separate from the application's memory allocator, and allocates memory in different memory regions.
Pin's dynamic memory allocation regions
By default, the memory address region used by Pin to dynamically allocate memory for both Pin usage and Pintool usage is unrestricted. However, if Pin memory allocation should be restricted to specific memory regions, the -pin_memory-range knob can be used in Pin's command line to make Pin allocate memory only inside the specified regions. Note that restricting Pin memory allocation to specific regions doesn't mean that it will allocate/reserve the entire memory available those regions!
the maximum memory that Pin can allocate
Pin can be forced to limit the amount of memory it can allocate (in bytes) by using the -pin_memory_size knob in Pin's command line. When a Pintool cannot allocate more memory due to -pin_memory_size limitation, its out of memory callback is called (see PIN_AddOutOfMemoryFunction()). By default, the number of bytes that Pin can allocate is unlimited. We recommend that if a memory limitation is specified, it will be at least 30MB.
mode
In JIT mode, Pin needs to manage memory for the code cache in addition to the dynamically allocated memory. This means that the memory regions specified by -pin_memory-range restricts both the dynamically allocated memory and the code cache blocks allocated by Pin.
In order to limit the code cache memory allocation, one can specify the -cc_memory_size knob in Pin's command line. Note that the specified limit must be a multiple of the code cache block size (specified with -cache_block_size).
Pin
Another component that requires memory while running Pin on an application is the images of Pin, tool, and their shared libraries (aka dynamic link libraries).
In order to restrict the memory that Pin image loader will use when placing the images mentioned above, one can use the -restrict_memory knob in Pin's command line. This will specify memory regions that the Pin loader should not use. Note that the logic of the -restrict_memory knob is reversed from all the other memory range knobs for Pin - as it specifies which memory regions the Pin loader should NOT use.
Pintool Information and Restrictions
PinCRT
Pin is built and distributed with its own OS-agnostic, compiler-agnostic runtime, named PinCRT. PinCRT exposes three layers of generic APIs which practically eliminate Pin's and the tools' dependency on the host system:
- A generic operating system interface, supplying basic OS services such as process control, thread control etc.
- A C-runtime layer supplying a standard C implementation. This is complemented by compiler-runtime functions necessary for enabling gcc, msvc, clang and icc.
- A C++ runtime. Please note that the current version does not support C++11 and RTTI (Run-Time Type Information).
Tools are obliged to use (link with) PinCRT instead of any system runtime. Tools must refrain from using any native system calls, and use PinCRT APIs for any needed functionality. Note that PinCRT APIs may differ from the native system APIs. For additional information see the OS APIs user guide in extras/crt/docs/html and the PinCRT documentation at https://software.intel.com/sites/default/files/managed/8e/f5/PinCRT.pdf
General
Tools are restricted from linking with any system libraries and/or calling any system calls. See PinCRT for more information.
There are several things that a Pintool writer must be aware of.
- IARG_REG_VALUE cannot be used to pass floating point register values to an analysis routine.
- Also, see the OS-specific restrictions below. Windows OS or Linux OS
Often, a Pintool writer wants to run the SPEC benchmarks to see the results of their research. There are many ways one can update the scripts to invoke Pin on the SPEC tests; this is one. In your $SPEC/config file, add the following two lines:
Now the SPEC harness will automatically run Pin with whatever benchmarks it runs. Note that you need the full path name for Pin and Pintool binaries. Replace "intel64" with "ia32" if you are using a 32-bit system.
Linux OS
Pin identifies system calls at the actual system call trap instruction, not the libc function call wrapper. Tools need to be aware of oddities like this when interpreting system call arguments, etc.
Windows OS
Tool are restricted from calling any win32 APIs. All system interaction should go through PinCRT.
Pin on Windows separates DLLs loaded by the tool from the application DLLs - it makes separate copies of any DLL loaded by Pin and Pintool using the PinCRT loader. Separate copies of system DLLs are not supported by the OS. In order to avoid isolation problems, Pintool should not dynamically load any system DLL. For the same reason, Pintool should avoid static links to any system DLL.
In probe mode, the application runs natively, and the probe is placed in the original code. If a tool replaces a function shared by the tool and the application, an undesirable behavior may occur. For example, if a tool replaces EnterCriticalSection() with an analysis routine that calls printf(), this could result in an infinite loop, because printf() can also call EnterCriticalSection(). The application would call EnterCriticalSection(), and the control flow would go to the replacement routine, and it would call EnterCriticalSection() (via printf) which would call the replacement routine, and so on.
Conflicts between Pin and Windows
Pin uses some base types that conflict with Windows types. If you use "windows.h", you may see compilation errors. To avoid this problem, we recommend wrapping the windows.h file as follows. Items that reside in the windows.h file must be referenced using the WINDOWS:: prefix.
Building Tools on windows
Building Tools in Visual Studio
An example VS project that builds Pintool in the Visual Studio IDE can be found in the \source\tools\MyPinTool directory. Enter this directory and open the project or solution file. To build the tool, select "Build Solution".
To run an application, instrumented by MyPinTool, select Tool->External Tools. In the "Menu contents" window choose "run pin". Add to the "Arguments" box the path of the required application that you want to run with Pin. For example: -t MyPinTool.dll -count 1 – "C:\Users\..\my_app.exe" and select "OK". A Popup window may appear on the screen with the following message: "The command is not a valid executable. Would you like to change the command?" select "No". To start running your application select Tool->pin run.
You can select another application and change tool's switches in the "MyPinTool Properties->Debugging" page.
You can use MyPinTool as a template for your own project. Please, look carefully at the compilation and linking switches in the MyPinTool property pages. Mandatory switches can be found in the win.vars file in the kit's source/tools/Config directory. Also note the library order, as this is important, too. See Pin's makefile Infrastructure for further details.
Constructing PinTools from multiple DLLs on Windows
A Pintool can be composed from multiple DLLs:
- "main DLL", which is specified in the Pin command line after "-t" switch
- a number of "secondary DLLs", linked to the "main DLL" statically.
When considering this configuration, take into account that multi-DLL Pin tool may increase memory fragmentation and cause layout conflicts with application images. If there is no compelling reasons for using multiple DLLs, build your tool as a single DLL to reduce the risk of memory conflicts.
Limitations and instructions:
- Don't use any Pin API in "secondary DLLs". Only "main DLL" can use Pin API!
- In order to run Pintool put "main DLL" and its "secondary DLLs" in the same directory.
- IMPORTANT: Build each DLL with the recommended Pintool building flags (see Building Tools in Visual Studio).
- Remove /EXPORT:main link flag for "secondary DLLs".
- Specify different base address for each DLL (/BASE link flag). When choosing base addresses, try to minimize memory fragmentation and layout conflicts.
Supported executables
Pin can instrument Windows* subsystem executables.
It can't instrument other executables (such as MS-DOS, Win16 or a POSIX subsystem executables).
Libraries for Windows
Pin on Windows uses dbghelp.dll by Microsoft* to provide symbolic information. dbghelp.dll version 6.11.1.404 is distributed with the kit. Please use the provided version, as other versions may not work properly with Pin.
Libraries for Linux
The "pin" Executable (Launcher)
The kit's root directory contains a "pin" executable. This is a 32-bit launcher, used for launching Pin in 32 and 64 bit modes. The launcher sets up the environment to find the libraries supplied with the kit. The kit's runtime directories will be searched first, followed by directories that are on the LD_LIBRARY_PATH. The launcher will then invoke the actual Pin executable - "pinbin".
If you need to change the directory structure or copy pin to a different directory, then you should note the following. The "pin" launcher expects the binary "pinbin" to be in the architecture-specific "bin" subdirectory (e.g. ia32/bin). The launcher expects the libraries to be found in the architecture-specific "runtime" and subdirectory (i.e. ia32/runtime). If you need a different directory structure, you need to build your own launcher or find a different way to set up the environment to allow the pinbin executable to find the necessary runtime libraries. The pinbin binary itself makes no assumptions about the directory structure. The launcher's sources may be found in <kit root>/source/launcher.
Installing Pin
To install a kit, unpack a kit and change to the directory.
Linux:
$ tar zxf pin-3.2-81205-gcc-linux.tar.gz
$ cd pin-3.2-81205-gcc-linux
Windows: Unzip the installation files, extracting all files in the kit.
$ cd pin-3.2-81205-msvc-windows
For better security, be advised to install on secure location.
Building Your Own Tool
Table of Contents
To write your own tool, copy one of the example directories and edit the makefile.rules file to add your tool. The sample tool MyPinTool is recommended. This tool allows you to build either inside or outside the kit directory tree. See Adding Tests, Tools and Applications to the makefile and Defining Build Rules for Tools and Applications for further details on makefile modification.
Building a Tool From Within the Kit Directory Tree
You may either modify MyPinTool or copy it as directed above. If you're using MyPinTool, and the default build rule suffices, you may not have to change makefile.rules. If you are adding a new tool, or you require special build flags for your tool, you will need to modify the makefile.rules file to add your tool and/or specify a customized build rule.
Building YourTool.so (from YourTool.cpp):
make obj-intel64/YourTool.so
For the IA-32 architecture, use "obj-ia32" instead of "obj-intel64". See @UsefulVariables for commonly used make flags to add to your build.
Building a Tool Out of the Kit Directory Tree
Copy the MyPinTool directory to a place of your choosing. This directory will serve as a basis for your tool. Modify the makefile.rules file to add your tool and/or specify a customized build rule.
Building YourTool.so (from YourTool.cpp):
make PIN_ROOT=<path to Pin kit> obj-intel64/YourTool.so
For the IA-32 architecture, use "obj-ia32" instead of "obj-intel64". See @UsefulVariables for commonly used make flags to add to your build.
For changing the directory where the tool will be created, override the OBJDIR variable from the command line:
make PIN_ROOT=<path to Pin kit> OBJDIR=<path to output dir> <path to output dir>/YourTool.so
Pin's makefile Infrastructure
Table of Contents
- Using Pin's makefile Infrastructure
- The Config Directory
- The Test Directories
- Adding Tests, Tools and Applications to the makefile
- Defining Build Rules for Tools and Applications
- Defining Test Recipes in makefile.rules
- Useful make Variables and Flags
Using Pin's makefile Infrastructure
Pintools are built using make on all target platforms. This section describes the basic flags available in Pin's makefile infrastructure. This is not a makefile tutorial. For general information about makefiles, refer to the makefile manual available at http://www.gnu.org/software/make/manual/make.html.
The Config Directory
The source/tools/Config directory holds the common make configuration files which should not be changed and template files which may serve as a basis for your own makefiles. This sections gives a short overview of the most notable files in the directory. The experienced user is welcome to read through the complete set of configuration files for better understanding the tools' build process.
makefile.config: This is the first file to be included in the make include chain. It holds documentation of all the relevant flags and variables available to users, both within the makefile and from the command shell. Also, this file includes the OS-specific configuration files.
makefile.unix.config: This file holds the Unix definitions of the makefile variables. See makefile.win.config for the Windows definitions.
unix.vars: This file holds the Unix definitions of some architectural variables and utilities used by the makefiles. See win.vars for the Windows definitions.
makefile.default.rules: This file holds the default make targets, test recipes and build rules.
The Test Directories
Each test directory in source/tools/ contains two files in the makefile chain.
makefile: This is the makefile which will be invoked when running make. This file should not be changed. It holds the include directives for all the relevant configuration files of the makefile chain in the correct order. Changing this order may result in unexpected behavior. This is a generic file, it is identical in all test directories.
makefile.rules: This is the directory-specific makefile. It holds the logic of the current directory. All tools, applications and tests that should be built and run in a directory are defined in this file. See Adding Tests, Tools and Applications to the makefile for adding tests, tools and applications to makefile.rules.
Adding Tests, Tools and Applications to the makefile
This section describes how to define your applications, tools and tests in the makefile. The sections below describe how to build the binaries and how to run the tests.
The variables detailed below, hold the tests, applications and tools definitions. They are defined in the "Test targets" section of makefile.rules. See this section for additional variables and more detailed documentation for each variable.
TOOL_ROOTS: Define the name of your tool here, without the file extension. The correct extension, according to the OS, will be added automatically by make. For example, for adding YourTool.so:
TOOL_ROOTS := YourTool
APP_ROOTS: Define your application here, without the file extension. The correct extension according to the OS, will be added automatically by make. For example, for adding YourApp.exe:
APP_ROOTS := YourApp
TEST_ROOTS: Define your tests here without the .test suffix. This suffix will be added automatically by make. For example, for adding YourTest.test:
TEST_ROOTS := YourTest
Defining Build Rules for Tools and Applications
Default build rules for tools and applications are defined in source/tools/Config/makefile.default.rules. The default tool requires a single c/cpp source file and will generate a tool of the same name. For example, for YourTool.cpp make will generate YourTool.so with the default build rule. However, if your tool requires more than one source file, or you need a customized build rule, add your rule at the bottom of makefile.rules in the "Build rules" section". There is no need to add the $(OBJDIR) dependency to the build rule, it will be added automatically. This dependency creates the build output directory obj-intel64 (or obj-ia32 for the IA-32 architecture). See source/tools/Config/makefile.config for all available compilation and link flags.
Here are a few useful examples:
Building an unoptimized tool from a single source:
# Build the intermediate object file.
$(OBJDIR)YourTool$(OBJ_SUFFIX): YourTool.cpp
    $(CXX) $(TOOL_CXXFLAGS_NOOPT) $(COMP_OBJ)$@ $<

# Build the tool as a dll (shared object).
$(OBJDIR)YourTool$(PINTOOL_SUFFIX): $(OBJDIR)YourTool$(OBJ_SUFFIX)
    $(LINKER) $(TOOL_LDFLAGS_NOOPT) $(LINK_EXE)$@ $< $(TOOL_LPATHS) $(TOOL_LIBS)
Building an optimized tool from several source files:
# Build the intermediate object file.
$(OBJDIR)Source1$(OBJ_SUFFIX): Source1.cpp
    $(CXX) $(TOOL_CXXFLAGS) $(COMP_OBJ)$@ $<

# Build the intermediate object file.
$(OBJDIR)Source2$(OBJ_SUFFIX): Source2.c Source2.h
    $(CC) $(TOOL_CXXFLAGS) $(COMP_OBJ)$@ $<

# Build the tool as a dll (shared object).
$(OBJDIR)YourTool$(PINTOOL_SUFFIX): $(OBJDIR)Source1$(OBJ_SUFFIX) $(OBJDIR)Source2$(OBJ_SUFFIX) Source2.h
    $(LINKER) $(TOOL_LDFLAGS_NOOPT) $(LINK_EXE)$@ $(^:%.h=) $(TOOL_LPATHS) $(TOOL_LIBS)
Defining Test Recipes in makefile.rules
A default test recipe is defined in source/tools/Config/makefile.default.rules. For most users, this recipe is insufficient. You may specify your own test recipes in makefile.rules in the "Test recipes" section. There is no need to add the $(OBJDIR) dependency to the build rule, it will be added automatically. This dependency creates the build output directory obj-intel64 (or obj-ia32 for the IA-32 architecture).
Example:
YourTest.test: $(OBJDIR)YourTool$(PINTOOL_SUFFIX) $(OBJDIR)YourApp$(EXE_SUFFIX)
    $(PIN) -t $< -- $(OBJDIR)YourApp$(EXE_SUFFIX)
Useful make Variables and Flags
For a complete list of all the available variables and flags, see source/tools/Config/makefile.config . Here is a short list of the most useful flags:
PIN_ROOT: Specify the location for the Pin kit when building a tool outside of the kit.
CC: Override the default c compiler for tools.
CXX: Override the default c++ compiler for tools
APP_CC: Override the default c compiler for applications. If not defined, APP_CC will be the same as CC.
APP_CXX: Override the default c++ compiler for applications. If not defined, APP_CXX will be the same as CXX.
TARGET: Override the default target architecture e.g. for cross-compilation.
ICC: Specify ICC=1 when building tools with the Intel Compiler.
DEBUG: When DEBUG=1 is specified, debug information will be generated when building tools and applications. Also, no compilation and/or link optimizations will be performed.
Questions? Bugs?
Send bugs and questions at https://groups.io/g/pinheads. Complete bug reports that are easy to reproduce are fixed faster, so try to provide as much information as possible. Include: kit number, your OS version, compiler version. Try to reproduce the problem in a simple example that you can send us.
Disclaimer and Legal Information
The information in this manual is subject to change without notice and Intel Corporation assumes no responsibility or liability for any errors or inaccuracies that may appear in this document or any software that may be provided in association with this document. This document and the software described in it are furnished under license and may only be used or copied in accordance with the terms of the license. No license, express or implied, by estoppel or otherwise, to any intellectual property rights is granted by this document. The information in this document is provided in connection with Intel products and should not be construed as a commitment by Intel Corporation.
EXCEPT AS PROVIDED IN INTEL'S TERMS AND CONDITIONS OF SALE FOR SUCH PRODUCTS, INTEL ASSUMES NO LIABILITY WHATSOEVER, AND INTEL DISCLAIMS ANY EXPRESS OR IMPLIED WARRANTY, RELATING TO SALE AND/OR USE OF INTEL PRODUCTS INCLUDING LIABILITY OR WARRANTIES RELATING TO FITNESS FOR A PARTICULAR PURPOSE, MERCHANTABILITY, OR INFRINGEMENT OF ANY PATENT, COPYRIGHT OR OTHER INTELLECTUAL PROPERTY RIGHT. Intel products are not intended for use in medical, life saving, life sustaining, critical control or safety systems, or in nuclear facility applications.
Designers must not rely on the absence or characteristics of any features or instructions marked "reserved" or "undefined." Intel reserves these for future definition and shall have no responsibility whatsoever for conflicts or incompatibilities arising from future changes to them.
The software described in this document may contain software defects which may cause the product to deviate from published specifications. Current characterized software defects are available on request.
Intel, Xeon, and Intel Xeon Phi are trademarks of Intel Corporation in the U.S. and/or other countries.
Microsoft, Windows, and the Windows logo are trademarks, or registered trademarks of Microsoft Corporation in the United States and/or other countries.
Java is a registered trademark of Oracle and/or its affiliates.
Other names and brands may be claimed as the property of others.
Copyright 2004-2022 Intel Corporation.
Intel Corporation, 2200 Mission College Blvd., Santa Clara, CA 95052-8119, USA.