Frequent DRAM Accesses
This recipe explores profiling a memory-bound matrix application using the Microarchitecture Exploration and Memory Access analyses of the Intel® VTune™ Profiler to understand the cause of the frequent DRAM accesses.
Content expert: Dmitry Ryabtsev
Ingredients
This section lists the hardware and software tools used for the performance analysis scenario.
Application: matrix multiplication sample that multiplies 2 matrices of 2048x2048 size, matrix elements have the double type. The matrix_vtune_amp_axe.tgz sample package is available with the product in the <install-dir>/samples/en/C++ directory and from the Intel Developer Zone at https://software.intel.com/en-us/product-code-samples.
Performance analysis tools:
Intel® VTune™ Profiler version 2019 or newer: Microarchitecture Exploration (formerly, General Exploration), Memory Access analysis
NOTE:Starting with the 2020 release, Intel® VTune™ Amplifier has been renamed to Intel® VTune™ Profiler.
Most recipes in the Intel® VTune™ Profiler Performance Analysis Cookbook are flexible. You can apply them to different versions of Intel® VTune™ Profiler. In some cases, minor adjustments may be required.
Get the latest version of Intel® VTune™ Profiler:
From the Intel® VTune™ Profiler product page.
Download the latest standalone package from the Intel® oneAPI standalone components page.
Operating system: Linux*, Ubuntu* 16.04 64-bit
CPU: Intel® Core™ i7-6700K processor
Create a Baseline
The initial version of the sample code provides a naïve multiplication algorithm with the following code for the main kernel:
void multiply1(int msize, int tidx, int numt, TYPE a[][NUM], TYPE v[][NUM], TYPE c[][NUM], TYPE t[][NUM])
{
    int i,j,k;

    // Naive implementation
    for(i=tidx; i<msize; i=i+numt) {
        for(j=0; j<msize; j++) {
            for(k=0; k<msize; k++) {
                c[i][j] = c[i][j] + a[i][k] * b[k][j];
            }
        }
    }
}
Running the compiled application takes about 22 seconds. This is a performance baseline that could be used for further optimizations.
Run Microarchitecture Exploration Analysis
To have a high-level understanding of potential performance bottlenecks for the sample, start with the Microarchitecture Exploration analysis provided by Intel® VTune™ Profiler:
Click the
 New Project button on the toolbar and specify a name for the new project, for example: matrix.
 In the Configure Analysis window, select the Local Host target system type on the WHERE pane.
On the WHAT pane, select the Launch Application target type and specify an application for analysis.
On the HOW pane, click the browse button and select Microarchitecture Exploration analysis from the Microarchitecture group.
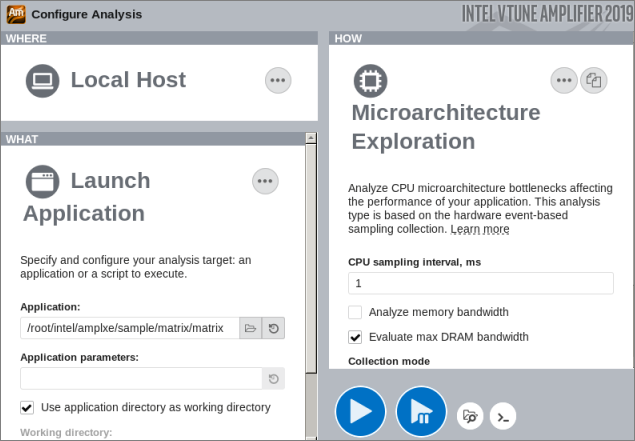
Click the
 Start button.
 VTune Amplifier launches the application, collects data, finalizes the data collection result resolving symbol information, which is required for successful source analysis.
Identify Hardware Hotspots
Microarchitecture Exploration helps you see dominant performance bottlenecks in your code. Start your analysis with the µPipe representation in the Summary view that displays CPU microarchitecture efficiency and CPU pipeline stalls for the analyzed application. According to the µPipe below, the output pipe flow is very narrow, which means that the Retiring metric value needs to be increased to improve application performance. The primary obstacle in the pipe is the Memory Bound metric value:
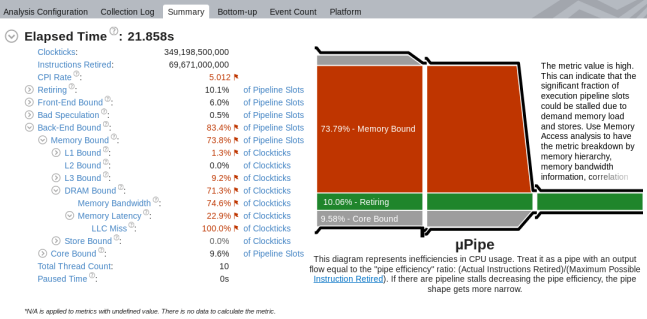
From the metric tree on the left, you see that performance is mostly bound by access to the DRAM.
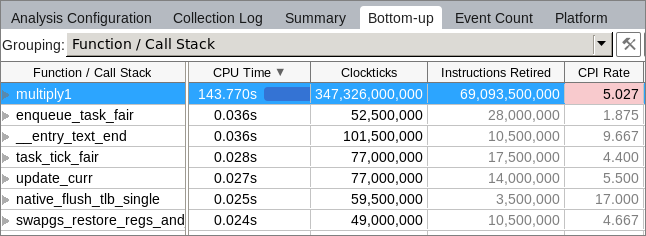
When you switch to the Bottom-up view, you see that the application has one big hotspot function multiply1:
Double-clicking this function opens the Source view that highlights the most performance-critical code line:
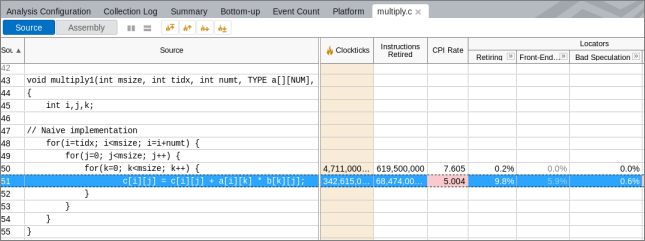
Almost all the time was spent in source line #51 that operates over three arrays - a, b, and c.
Run Memory Access Analysis
To find out an access to what array was the most expensive, run the Memory Access analysis with the Analyze dynamic memory objects option enabled:

Identify Hot Memory Accesses
The Summary window for the Memory Access analysis result shows the top memory objects as follows:

Click the first hotspot object matrix.c:121 in the list to switch to the Bottom-up view and then double-click this object highlighted in the grid to open the Source view and see the line allocating this memory object:
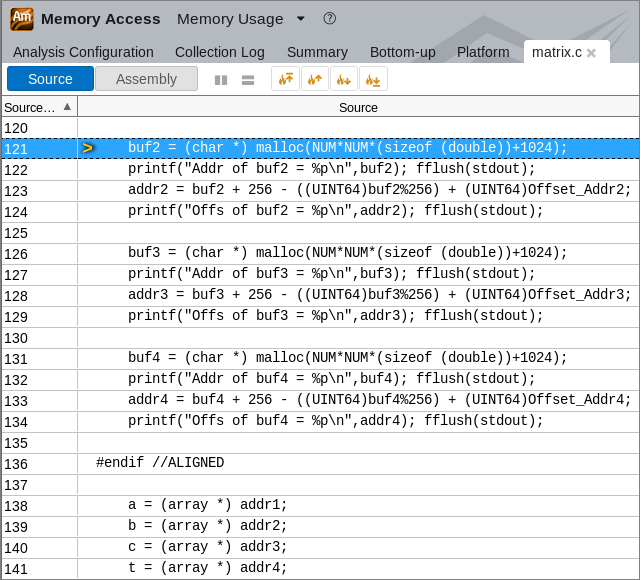
You see the allocation for the buf2 variable that is assigned to addr2, which is in its turn assigned to array b. So, you may conclude that the problematic array is b. Click the  Open Source File Editor button on the toolbar and have a look at the code again:
void multiply1(int msize, int tidx, int numt, TYPE a[][NUM], TYPE v[][NUM], TYPE c[][NUM], TYPE t[][NUM])
{
    int i,j,k;

    // Naive implementation
    for(i=tidx; i<msize; i=i+numt) {
        for(j=0; j<msize; j++) {
            for(k=0; k<msize; k++) {
                c[i][j] = c[i][j] + a[i][k] * b[k][j];
            }
        }
    }
}
You see now the root cause of the problem: the innermost cycle iterates over array b in an inefficient way. On each iteration it jumps over big chunks of memory.
Apply Loop Interchange for Optimization
Apply the loop interchange algorithm to j and k as follows:
for(i=tidx; i<msize; i=i+numt) {
				for(k=0; k<msize; k++) {
								for(j=0; j<msize; j++) {
            c[i][j] = c[i][j] + a[i][k] * b[k][j];
        }
    }
}
Compiling and running the new code will result in 1.3-second runtime, which is a significant 20x improvement over original 26 seconds.
What's Next
Re-run the Microarchitecture Exploration analysis on the optimized matrix code. The µPipe diagram shows a significant increase of the Retiring metric value, from 10.06% to 63.28%:
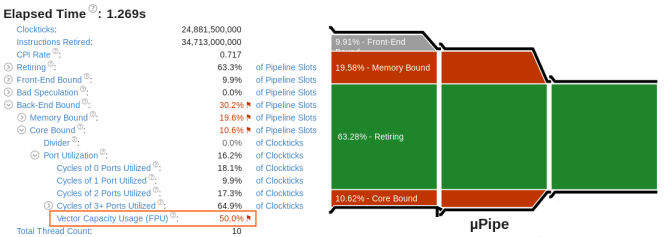
You can focus on other flagged metrics to identify further areas for improvement, for example: poor port utilization.
Parent topic: Tuning Recipes
See Also
Top-down Microarchitecture Analysis Method Use this recipe to know how an application is utilizing available hardware resources and how to make it take advantage of CPU microarchitectures. One way to obtain this knowledge is by using on-chip Performance Monitoring Units (PMUs).