Poor Port Utilization
This recipe explores profiling a core-bound matrix application using the Microarchitecture Exploration analysis (formerly, General Exploration) of the Intel® VTune™ Amplifier to understand the cause of the poor port utilization and Intel® Advisor to benefit from compiler vectorization.
Content expert: Dmitry Ryabtsev
Ingredients
This section lists the hardware and software tools used for the performance analysis scenario.
Application: matrix multiplication sample that multiplies 2 matrices of 2048x2048 size, matrix elements have the double type. The matrix_vtune_amp_axe.tgz sample package is available with the product in the <install-dir>/samples/en/C++ directory and from the Intel Developer Zone at https://software.intel.com/en-us/product-code-samples.
Performance analysis tools:
Intel VTune Amplifier 2019: Microarchitecture Exploration analysis
NOTE:Starting with the 2020 release, Intel® VTune™ Amplifier has been renamed to Intel® VTune™ Profiler.
Most recipes in the Intel® VTune™ Profiler Performance Analysis Cookbook are flexible. You can apply them to different versions of Intel® VTune™ Profiler. In some cases, minor adjustments may be required.
Get the latest version of Intel® VTune™ Profiler:
From the Intel® VTune™ Profiler product page.
Download the latest standalone package from the Intel® oneAPI standalone components page.
Intel Advisor: Vectorization analysis
Operating system: Linux*, Ubuntu* 16.04 64-bit
CPU: Intel® Core™ i7-6700K processor
Create Baseline
After optimizing the initial version of the matrix code with a naïve multiplication algorithm (see the Frequent DRAM Accesses recipe), the execution time has reduced from 26 seconds to 1.3 seconds. This is a new performance baseline for further optimizations.
Run General Exploration Analysis
Run the General Exploration analysis for high-level understanding of potential performance bottlenecks for the sample application:
Click the
 New Project button on the toolbar and specify a name for the new project, for example: matrix.
 The Configure Analysis window opens.
On the WHERE pane, select the Local Host target system type.
On the WHAT pane, select the Launch Application target type and specify an application for analysis.
On the HOW pane, click the browse button and select Microarchitecture Analysis > Microarchitecture Exploration.
Optionally, for such tiny workloads as this optimized matrix application, consider reducing the sampling interval to 0.1 seconds to get reliable metric values.
Click Start to run the analysis.

VTune Profiler launches the application, collects data, finalizes the data collection result resolving symbol information, which is required for successful source analysis.
Identify a Cause for Poor Port Utilization
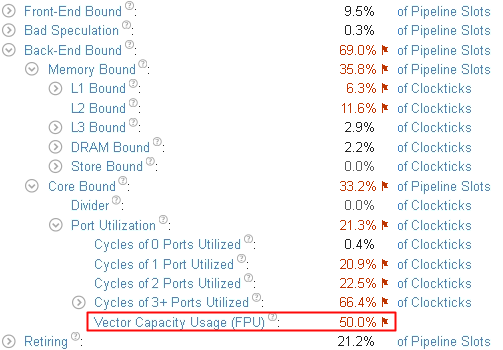
Start with the Summary view that shows high-level statistics for the application performance per hardware metrics:
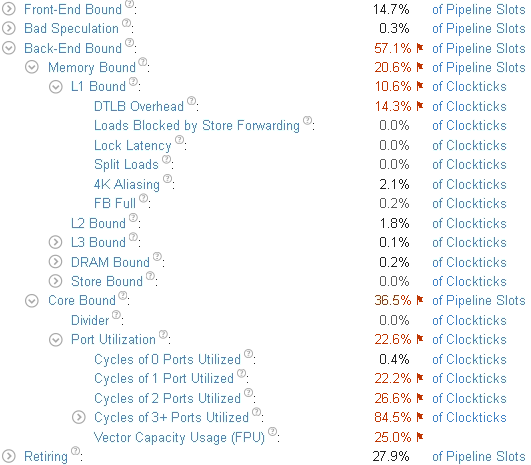
You see that the dominant bottleneck has moved to Core Bound > Port Utilization with more than 3 execution ports utilized simultaneously for the most of the time. Note that the Vector Capacity Usage metric value is also flagged as critical, which means that the code was either not vectorized or vectorized poorly. To confirm this, switch to the Assembly view of the kernel as follows:
Click the Vector Capacity Usage (FPU) metric to switch to the Bottom-up view sorted by this metric.
Double-click the hot multiply1 function to open its Source view.
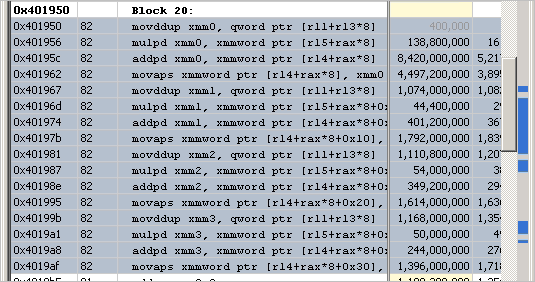
Click the Assembly button on the toolbar to view the disassembly code:
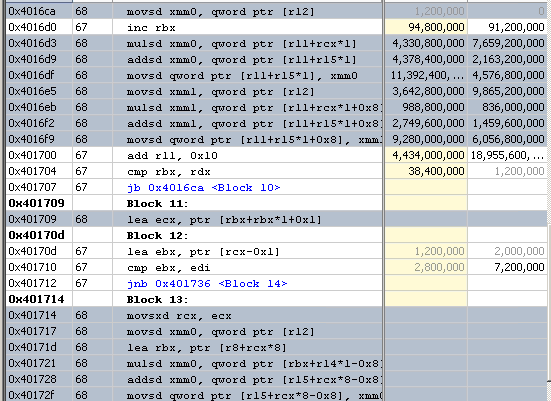
You see that scalar instructions are used. The code is not vectorized.
Explore Options for Vectorization
Use the Vectorization Advisor tool from Intel® Advisor to understand what prevents the code from being vectorized:
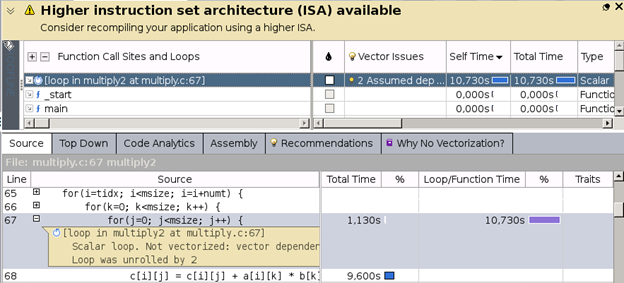
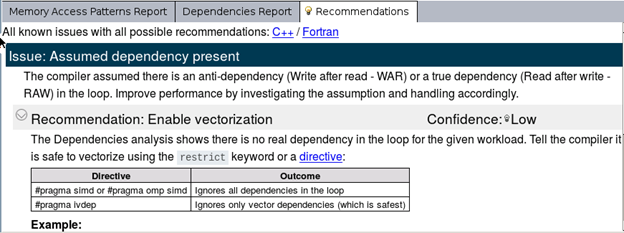
Intel Advisor says that the loop was not vectorized due to assumed dependencies. For further details, mark the loop and run the Dependencies analysis from Intel Advisor:
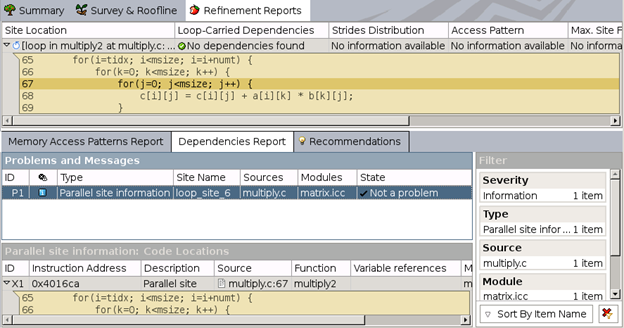
According to the report, there are no actual dependencies found and Intel Advisor recommends to use #pragma to make the compiler ignore the assumed dependencies:
With the #pragma added, the matrix code looks as follows:
void multiply2_vec(inte msize, int tidx, int numt, TYPE a[][NUM],
    TYPE b[][NUM], TYPE c[][NUM], TYPE t[][NUM]
{
    int i,j,k;

    for(i=tidx; i<msize; i=i+numt) {
        for(k=0; k<msize; k++) {
#pragma ivdep
            for(j=0; j<msize; j++) {
                c[i][j] = c[i][j] + a[i][j] * b[i][j];
            }
        }
    }
}
Compiling and running the updated code results in 0.7 second speed-up in the execution time.
Compile with the Latest Instruction Set
Re-running the VTune Profiler's Microarchitecture Exploration analysis on the latest code version provides the following result:
The Vector Capacity Usage is improved but it still only 50% and flagged as performance-critical. Explore the Assembly view again for more insight:
The Assembly view helps you discover that the code uses SSE instructions while the CPU used for this use case supports the AVX2 instruction set. To apply it, re-compile the code with the -xCORE-AVX2 option and re-run the General Exploration analysis.
For the recompiled code, the execution time has dropped to 0.6 seconds. Re-run the Microarchitecture Exploration analysis to verify the optimization. The Vector Capacity Usage metric value is now 100%:

Parent topic: Tuning Recipes