Performance Analysis with the Offload Advisor Feature of Intel® Advisor
Kevin O’Leary, lead technical consulting engineer, and
Md Khaledur Rahman, graduate technical intern, Intel Corporation
@IntelDevTools
Get the Latest on All Things CODE
Sign Up
Intel® oneAPI Toolkits provide a unified, standards-based programming model for delivering uncompromised performance for diverse workloads across multiple architectures. One recent addition is the Offload Advisor feature in Intel® Advisor, which you can use for interactive performance modeling. In this study, we explore Offload Advisor and see how it helps you see future performance headroom, or what hardware parameters are the most sensitive for a given application. This type of what-if study lets you explore how your application performs if some computations are offloaded to different GPUs. To conduct the analysis, we use the popular, high-performance Rodinia computational fluid dynamics (CFD) application.
Background
Heterogeneous parallelism was originally implemented in CUDA* for CFD. Basically, it computes a three-dimensional Euler’s equation for fluid dynamics. This application has intensive computation that makes it a compute-bound problem.
For this experiment, we migrated the CUDA application to Data Parallel C++ (DPC++) using the oneAPI compatibility tool, which is called the Intel® DPC++ Compatibility Tool. To learn more, see Heterogeneous Programming Using oneAPI from issue 39 of The Parallel Universe.
Methodology
In general, we used the following methodology:
- Run an analysis using Offload Advisor.
- From the report, see the main bottlenecks for the application. For example, is the workload bound by compute, memory, or some other factor?
- Based on the bottleneck, do a what-if analysis with various GPU configurations to see if this removes the bottleneck. For example, if the workload is compute-bound, try increasing the number of execution units (E-units).
The Rodinia application has high computational intensity and the offloaded regions are mostly compute-bound. When we examine the Offload Advisor report for the baseline version, we see that 92 percent of the offloads are compute-bound (Figure 1). This means, increasing computational units may help the application run faster. We can also see that the invocation tax is zero percent, which gives in an optimistic estimation for the offload regions. Other parameters are negligible for the current settings.
From the offload bounding parameters, we get an idea of which configuration we need to change to boost performance on the target. For example, if offloads are bounded by compute, we may want to increase E-units. On the other hand, if the offloads are bounded by memory bandwidth, we may want to increase the dynamic random-access memory (DRAM) bandwidth for the target to estimate speedup for GPU acceleration. Offload Advisor offers an interactive interface to tune the estimated performance on the target device (Figure 2). Notice there are several options to consider. For example, we can increase or decrease the E-units by moving the slider left or right. We can do the same for other parameters, and then download the configuration by clicking on the icon, which we can use for future analysis.
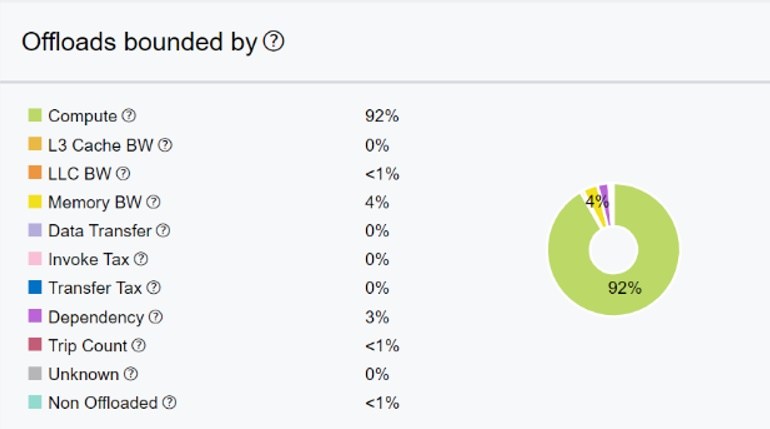
Figure 1. Breakdown of offload bounding parameters

Figure 2. Estimate performance by changing the configuration of the target device.
Results
For all the experiments, we use the fvcorr.domn.097K dataset. We disable the invocation tax in our experiments using the option—jit. We run the baseline version, collect results, and analyze using Offload Advisor. We collected results as follows:

To analyze the results, we use the following command:

The report file is written to the perf_models/m0000 folder. Click on the report .html file and see the results in your web browser. Every time we rerun the analysis, it creates a folder with prefix m**** inside the perf_models folder. There are several windows in the report file, but we focus on the results summary (Figure 3).
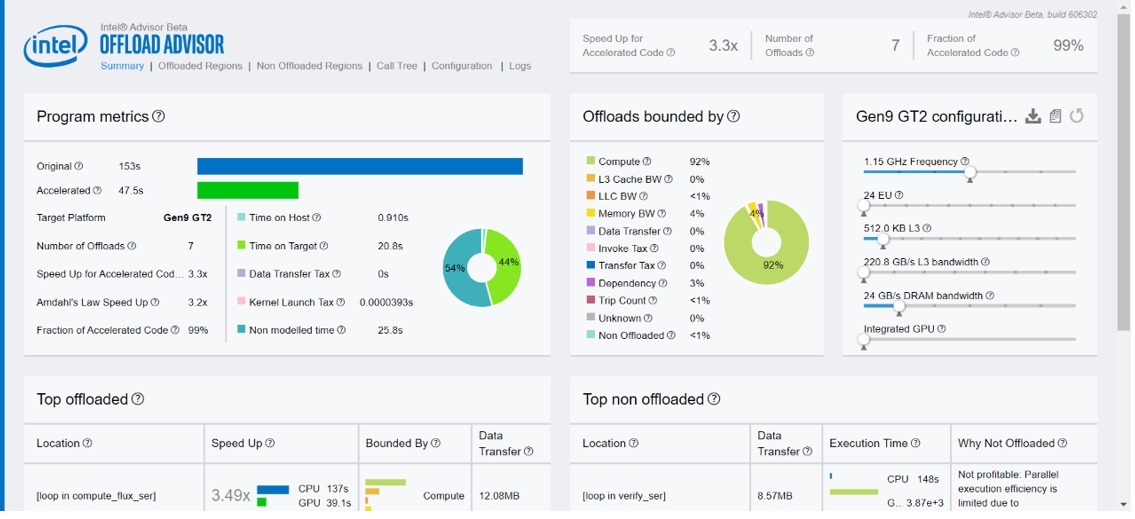
Figure 3. Summary of Offload Advisor feature from Intel Advisor
We observe in Figure 3 that the baseline version spends 44 percent of the time on the target device and achieves around a 3.3x speedup for the accelerated code. We also see that the offloads are mostly compute-bound.
Increasing E-units may also improve speedup. We can use sliders on the configuration window to adjust the value based on the expectation. To perform this experiment, we create and download a configuration file, named scalers.toml, multiplying the E-unit's counter by two. We generate this from the report.html file by changing options on the right side under the Gen9 GT2 configuration and clicking to download. Make sure that there is a line EU_count_multiplier=2 in the toml file. All other options remain the same. Then, we rerun the analysis.

We observe that the E-units are now 48 and the speedup also increases for the accelerated code. The offload regions remain compute-bound (Figure 4).

Figure 4. Summary of Offload Advisor for 2x more E-units than baseline
Since the offloaded regions are compute-bound, we further increase the E-units by setting EU_count_multiplier=4 in the toml file. It uses 96 E-units. We rerun the analysis as follows:

We observe that the speedup increases. However, the offloaded regions are now L3 bandwidth-bound (Figure 5).
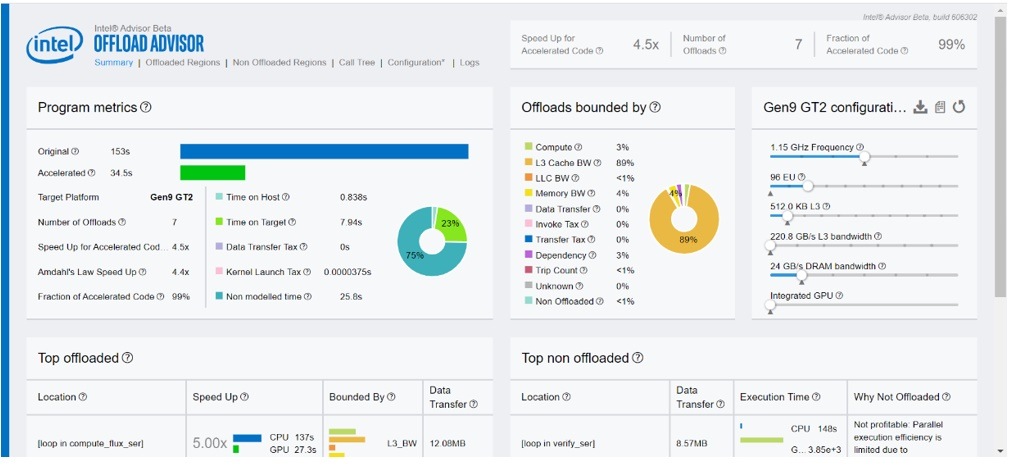
Figure 5. Summary of Offload Advisor for 4x more E-units than baseline
We want to increase the speedup by setting EU_count_multiplier=6. Because the offloaded regions are now L3 bandwidth-bound, increasing the number of E-units doesn’t help (Figure 6). The speedup of accelerated code remains the same. We rerun the analysis, which creates a folder named m0003 in the perf_models folder.
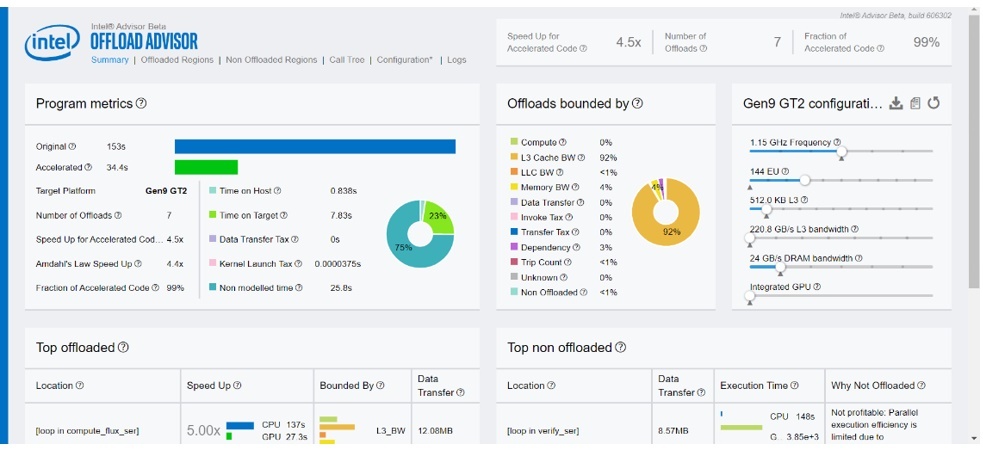
Figure 6. Summary of Offload Advisor for 6x more implementation units than baseline
Next, we focus on increasing L3 bandwidth in the scalers.toml file. We can do this by setting L3_bandwidth_multiplier=2. We keep the other parameters the same and rerun the analysis.

In the reports.html file, we can see that L3 bandwidth jumps from 220.8 Gbps to 441.6 Gbps, and speedup also increases. However, the offloaded regions remain L3 bandwidth-bound (Figure 7).
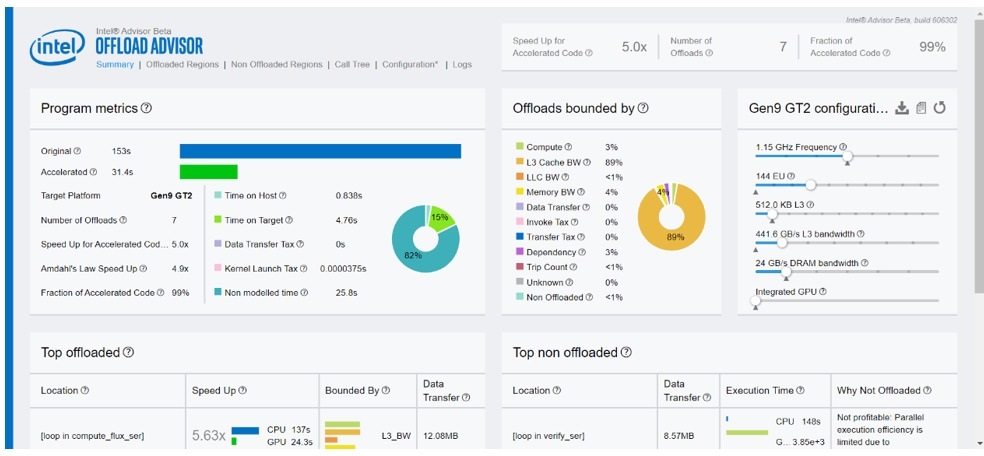
Figure 7. Summary of Offload Advisor for 6x more E-units and 2x higher L3 bandwidth
Since the offloaded regions are still L3 bandwidth-bound, we increase L3 bandwidth to see the effect and rerun the analysis phase as before. This didn’t change the speedup. Interestingly, it makes the offloaded regions compute-bound again. This is shown in Figure 8, where we see that the L3 bandwidth is now 1.1 Tbps but there is no change in the speedup.

Figure 8. Summary of Offload Advisor for 6x more E-units and 5x higher L3 bandwidth
Again, we increase E-units by setting EU_count_multiplier=8 and rerun the experiment. This shows a speedup, but the offloaded regions are now mostly memory-bound (Figure 9).

Figure 9. Summary of Offload Advisor for 8x E-units units and 5x L3 bandwidth
Finally, we increase the memory bandwidth by setting Memory_bandwidth=360000000000 in the toml file and rerun the experiment keeping other parameters the same. As shown in Figure 10, this setting increases the speedup of accelerated code a little. Notably, the offloaded regions are now compute-bound again.
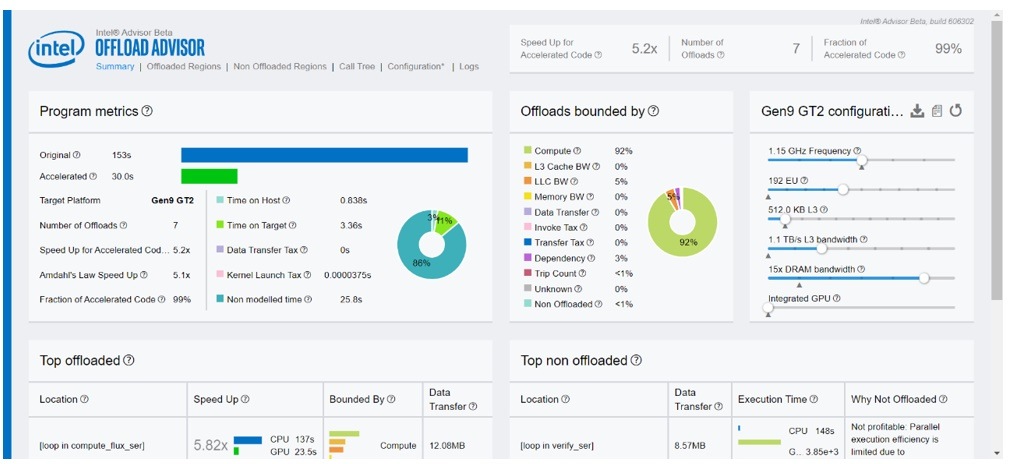
Figure 10. Summary of Offload Advisor for 8x E-units units, 5x L3 bandwidth, and 15x memory bandwidth
Conclusion
The Offload Advisor feature of Intel Advisor can help you speed-up the performance of your application on target devices, both present and future, with many options to explore different GPU configurations.
______
You May Also Like
| Intel® Advisor Design code for efficient vectorization, threading, memory usage, and GPU offloading. Intel Advisor is included as part of the Intel® oneAPI Base Toolkit. Get It Now See All Tools |