Tutorial
Visible to Intel only — GUID: GUID-13D60AAB-D83D-4951-A8BB-9C4E1D638F28
Analyze Optimized Communications
Investigate other instances of time-consuming MPI calls in the revised application. To do this:
Open the Summary Page for the poisson_icomm.single.stf to see the MPI- and CPU-time ratio and get information about the most time-consuming MPI functions. To open the Summary Page, click the
 toolbar button.
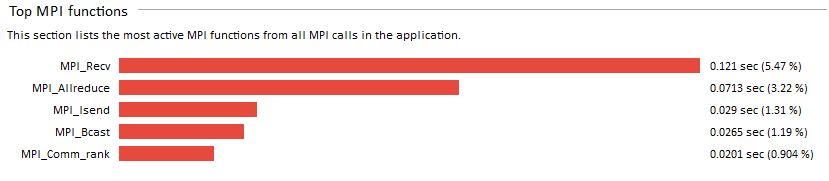
You can see that it is the MPI_Recv function that consumes 5.47% of the MPI time. To take a closer look at the function, click Continue here and go to the Event Timeline.
Open the Event Timeline, zoom into the first bunch of MPI communications and ungroup grouped MPI calls.
Zoom deeper to see the MPI_Recv calls closer:
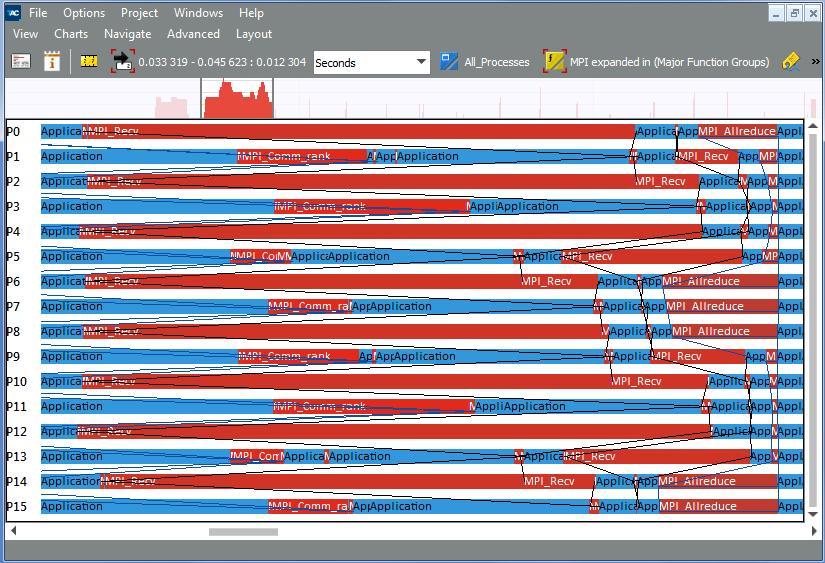
You can see that the processes starting from P1 have already called MPI_Recv, but are waiting for P0 to send data. This kind of communication generates imbalance which is later reduced by MPI_Allreduce resynchronizing all the MPI_Recv calls.
To prove that it is exactly the MPI_Recv call that causes imbalance, analyze the application with Intel® VTune™ Profiler.
Parent topic: Optimizing MPI Communications