Tutorial
Interpret Results
Explore the application-level performance:
VTune Profiler opens with the Summary page. Use this page as a starting point for the analysis of your application. In the Elapsed Time section of the Summary page, find out the elapsed time. For the current application it is 0.463 seconds:
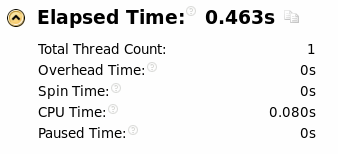
This display also indicates that this is a single-threaded application with the CPU time equal to 0.080 seconds.
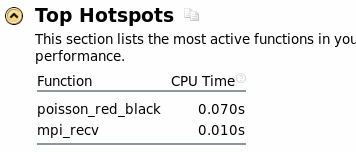
In the Top Hotspot section, see the most time-consuming functions. For the poisson application, they are poisson_red_black_ and mpi_recv.
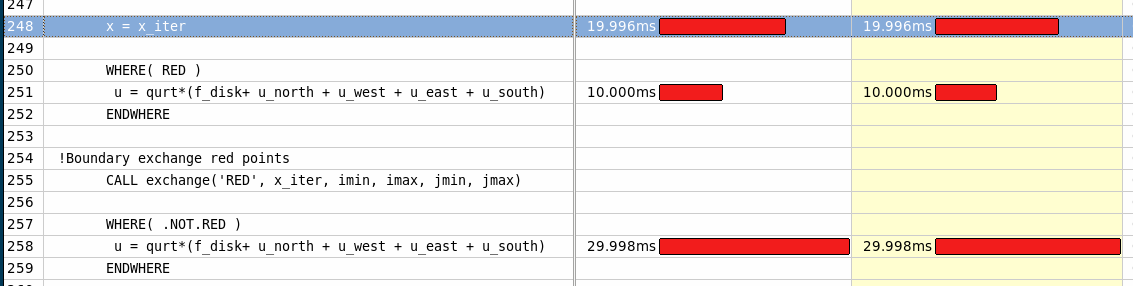
To analyze the most time-consuming functions, click the Bottom Up tab. Take a look at the CPU Time column, in which you can see that it took 70.010 milliseconds to execute the most time consuming function of the application and 9.990 milliseconds to execute MPI_Recv.
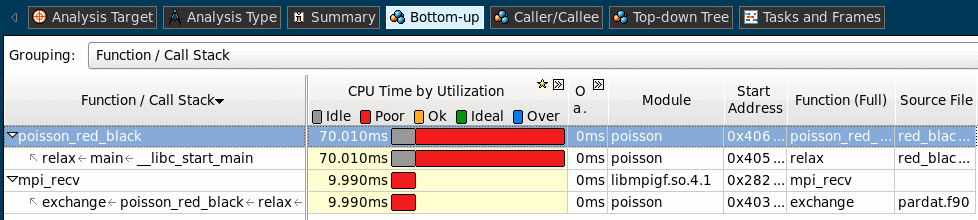
NOTE:To see MPI functions under the Bottom-Up tab, make sure that Call Stack Mode at the bottom of the tab is set to User Functions + 1It proves that the result we saw in the Intel® Trace Analyzer Event Timeline is correct: this is the MPI_Recv call that generates imbalance in the application. Since there is no need to optimize this kind of logical imbalance, proceed with the analysis.
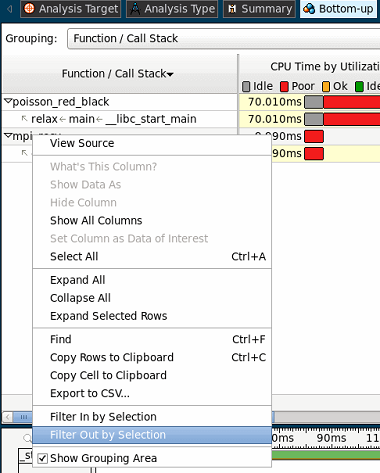
To see the imbalance created by the other function, filter the MPI_Recv out of the analysis scope. To do this, right-click the function at the Bottom-Up tab and select Filter Out By Selection, as shown in the example:
Take a look at the function with poor CPU usage. Double-click the poisson_red_black_ function to open the source and identify the hotspot code regions. The beginning of the hotspot function is highlighted. The source code in the Source pane is not editable.
NOTE:To enable the Source pane, make sure to build the target with debugging symbols using the -g (Linux* OS) and /Zi (Windows* OS) compiler flags.For the poisson application, you can see the cycle in which computation took most of the CPU time.
Two options for resolving the issue are vectorize, or parallelize the cycle.
For more detailed explanations and more methods for analysis of your application, refer to the Analyze Common Performance Bottlenecks with Intel VTune Profiler for Windows* OS and Analyze Common Performance Bottlenecks with Intel VTune Profiler for Linux* OS.
Parent topic: Improving Intra-process Performance