Tutorial
Visible to Intel only — GUID: GUID-C0E6B536-D0CF-4929-BC7C-9500A1B0F09D
Analyzing an MPI Application
Use Intel Trace Analyzer to conduct a performance analysis and tune MPI communications between processes. Then switch to the VTune Profiler to carry out a new round of analysis and identify hotspots on specific processes.
This tutorial uses the poisson sample code as well as the sample trace files poisson_sendrecv.single.stf and poisson_icomm.single.stf to demonstrate the interoperability of the Intel Trace Analyzer and VTune Profiler that enables you to analyze and further tune the application.
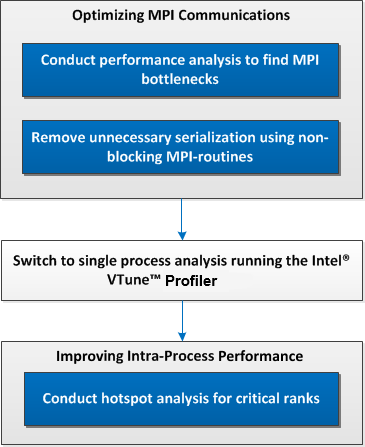
| Step 1: In Intel Trace Analyzer and Collector, Optimize MPI communications |
|
| Step 2: In VTune Profiler, Improve intra-process performance |
|