Tutorial
Visible to Intel only — GUID: GUID-ECC246C6-1B52-4581-9908-C23AFD693007
Prepare for Analysis
To analyze the application, start with the following steps:
Open the poisson_sendrecv.single.stf sample trace file.
Go to Charts > Event Timeline to open the Event Timeline.
NOTE:When you open a new trace file, Function Profile and Performance Assistant charts open by default. You can change the default chart in the Preferences dialog box (Options > Preferences > Tracefile preferences).In the Event Timeline, click and drag your mouse over a specific time interval to zoom into it.
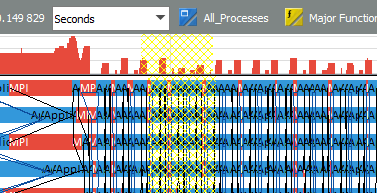
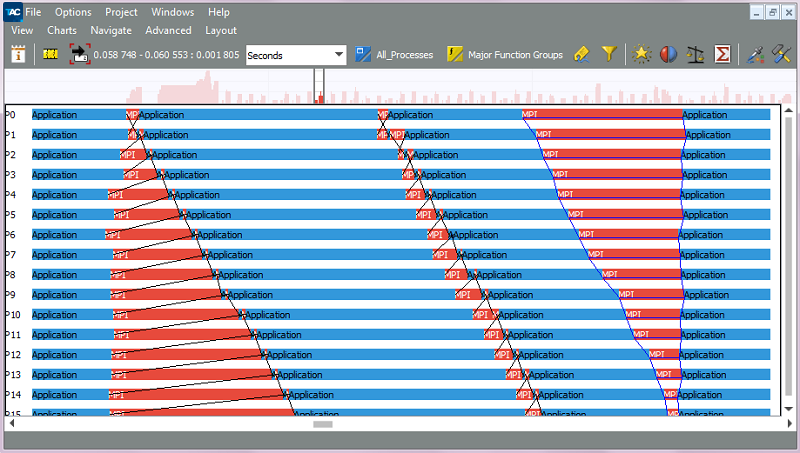
You should start noticing the iterative nature of the application. Zoom deeper into the trace by selecting a single iteration.
This is the view of the zoom. The Trace Map shows the section within the trace that is displayed. The Event Timeline chart shows the events that were active during the selected time.
Parent topic: Optimizing MPI Communications