Tutorial
Visible to Intel only — GUID: GUID-E99BE318-00F7-4BEE-A58E-C185C4CB5683
Starting Intel® Trace Analyzer
Invoke the Intel Trace Analyzer GUI.
On Linux* OS, enter the command:
$ traceanalyzer [<trace_file>.stf]
On Windows* OS, navigate to an .stf file and double-click to open it in the Intel Trace Analyzer.
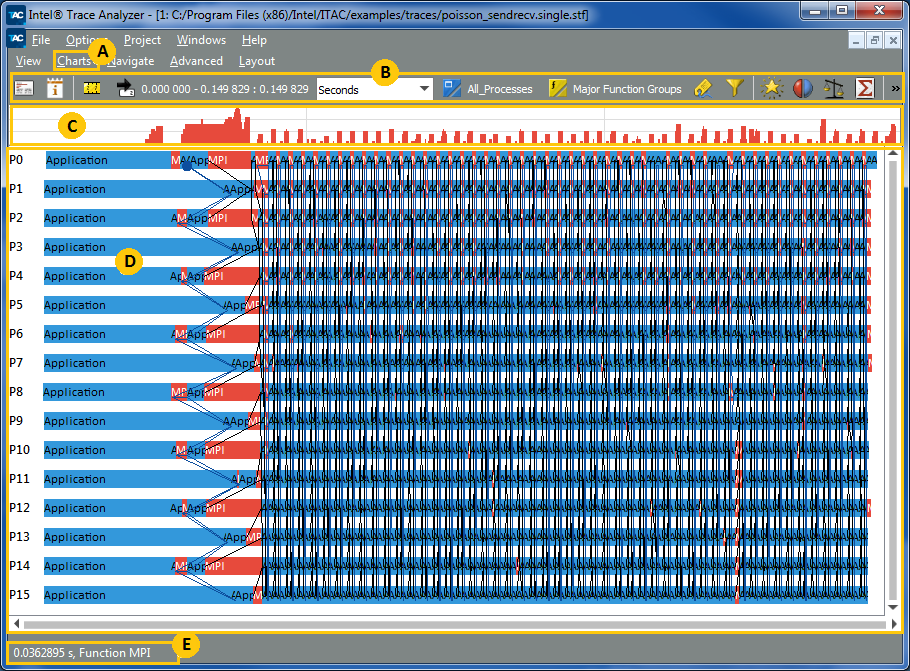
Intel® Trace Analyzer GUI
 |
Use the Charts menu to open and navigate the various Intel Trace Analyzer charts within the current tracefile and use them to analyze the application trace data. |
 |
Use the Toolbar buttons to control the display of the currently open trace file. |
 |
The Trace Map displays the MPI function activity for the application over time. MPI function activity is displayed in red. Drag your mouse on a section in the Trace Map to zoom into the relevant subsets of tracefile charts. This map appears for all the charts. |
 |
The currently open chart is the Event Timeline. This chart displays individual process activities over time. Horizontal bars represent the processes with the functions called in these processes. The bars consist of colored rectangles labeled with the function names. Black lines indicate messages sent between processes. These lines connect sending and receiving processes. Blue lines represent collective operations, such as broadcast or reduce operations. To change the displayed chart, go to Charts. |
 |
The Status Bar displays the exact time point and function type when you hover the mouse over the processes shown in the Event Timeline. |