Tutorial
Visible to Intel only — GUID: GUID-115E92C8-328C-4829-BDBE-6F1247969BDC
Compare Original Trace File With Idealized Trace File
See your application under the ideal circumstances and compare the original trace file with the idealized one to isolate problematic interactions.
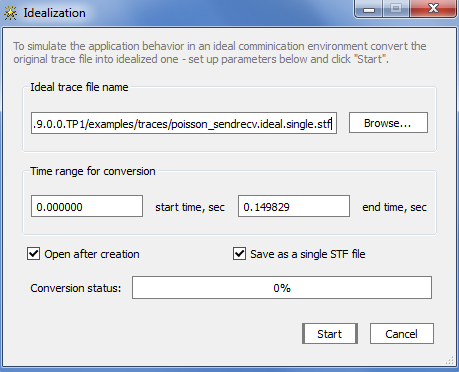
Create the idealized trace:
In the poisson_sendrecv.single.stf view, select Advanced > Idealization, or use the
 toolbar button.
 In the Idealization dialog box, check the idealization parameters. By default, Intel Trace Analyzer stores the idealized trace in the local folder where the original trace file was opened. The default name of the new ideal trace file is the input trace file name with the suffix ideal added before the .stf extension.
Click Start to idealize the trace poisson_sendrecv.single.stf.
To get more information on idealization, refer to the Idealization Dialog Box section of the Intel® Trace Analyzer User and Reference Guide.
Compare the original trace file with the idealized trace:
In the poisson_sendrecv.single.stf view, select Advanced > Imbalance Diagram or press the
 toolbar button.
 In the Imbalance Diagram dialog box, press the Open Another File button, navigate to the idealized trace poisson_sendrecv.ideal.stf and select it.
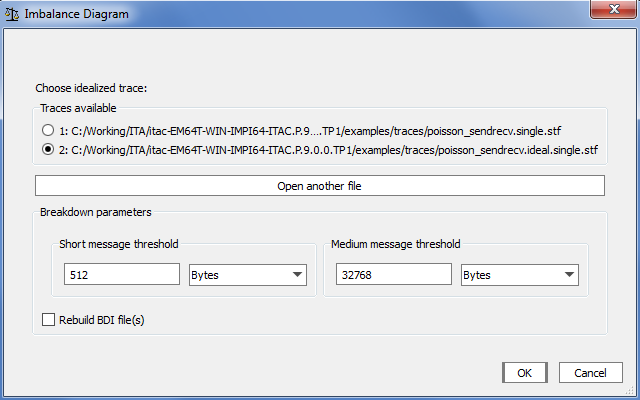
Click OK.
In the Imbalance Diagram window, click the Total Mode button and select Breakdown Mode.
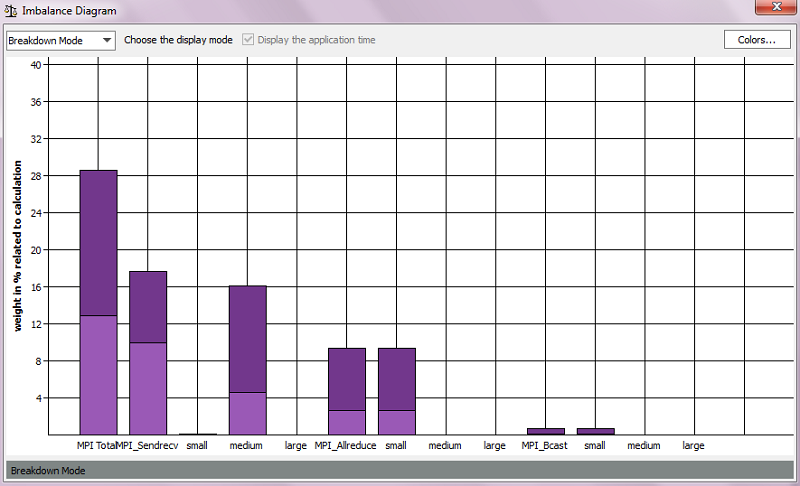
This chart shows you a breakdown of the interconnect vs. imbalance overhead in your application, as well as which MPI routines are at fault. You can see that MPI_Sendrecv is the most time-consuming function. The imbalance weight is displayed in the light purple color and comprises about 10% for the MPI_Sendrecv function. This is the time the processes spend waiting for each other.
Parent topic: Optimizing MPI Communications